


Where are the (less recent) selective sweeps?
A murky picture of selection in the past 50,000 years from ancient and modern DNA


In a previous post, I discussed how genetic data can provide evidence of recent selection. The broad takeaway was that locus-specific selection in the past 5,000 years appears to be extremely rare and idiosyncratic:

Here I want to keep moving backwards from 5,000 years to 50,000 years and discuss some recent studies that might change our understanding evolution during this time. To do that, let’s first look at the potential confounders of selection and then what the data show.
Why is it hard to detect a selective sweep?
At it’s core, a test for locus-specific selection seeks to identify genetic patterns that deviate from what would be expected under neutrality. This task is made difficult by competing neutral processes that introduce deviations of their own.
Genetic drift
When data is available from multiple time points, one could imagine a basic test for selection that simply quantifies whether allele frequencies have changed at all. In real populations, however, allele frequencies can also change due to neutral genetic drift: the random walk that alleles take over the course of successive generations. To illustrate this, the figure below shows results under neutrality (black) and positive selection (blue) for populations with (right) and without (left) drift. In a world without drift, allele frequencies stay exactly the same over time. In our world, drift variance leads some neutral allele frequencies to shift significantly and some selected alleles to stay the same.

To make things more complicated, the magnitude of drift depends on the demographic history of the population: the smaller the effective population size, the more alleles can change frequencies over generations (i.e. the larger the steps in the random walk), and the larger the drift variance. The figure below shows the allele frequency changes between two time points for selected (red) and neutral (black) alleles. In an infinitely sized population with no drift, this reverts to a naive test for any frequency difference and all selected alleles are detectable. But with realistic (10,000) and small (1,000) effective population sizes, the ability to distinguish alleles under selection becomes more limited.
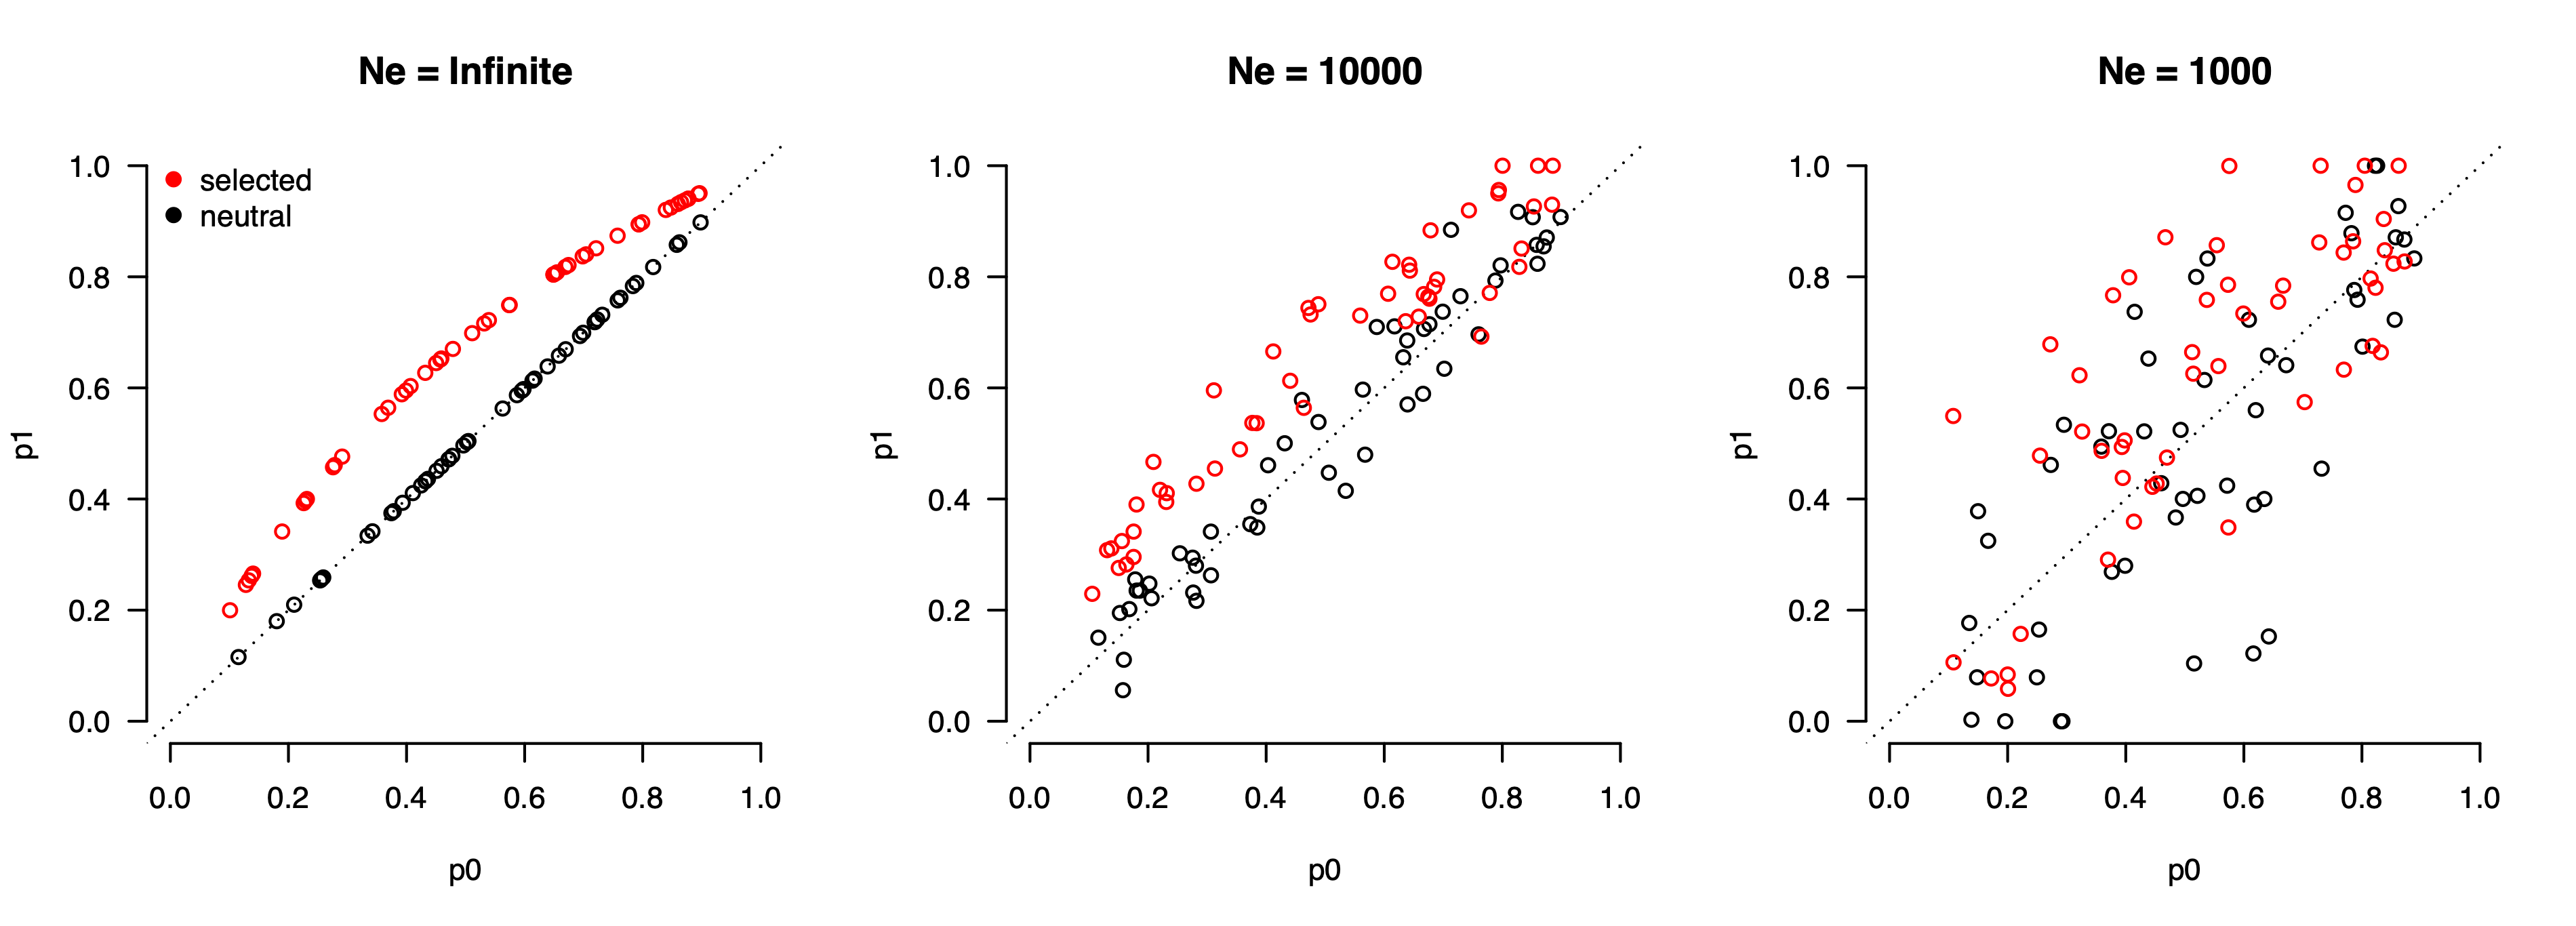
Importantly, this limitation cannot be overcome solely by increasing the sample size. Since we only get to observe the allele frequency once in a population, additional samples do not provide additional power beyond the accuracy of the frequency estimate itself (which can typically be obtained with tens/hundreds of samples). For example, in the population with Ne=1,000 there are many alleles under selection (red points) that have frequency differences lower than those of neutrally drifting alleles, including some selected variants that have not changed frequency at all (because drift counter-acted the selective pressure). Such variants fundamentally cannot be identified as being under selection from frequency alone. This is in contrast to association studies (GWAS), which can identify increasingly weaker and weaker effects on a trait as the sample size increases because estimation error is the dominant source of noise.
Gene flow
While drift adds random variation to the genetic data, gene flow introduces systematic changes due to the influx of new genetic material from a previously separated population. The figure below, from an analysis of ~1,600 ancient genomes by Irving-Pease et al. (2024), shows a tree-based reconstruction of the primary flows of genetic ancestry, starting from the Out of Africa migrations at the top and leading to modern-day Europeans at the bottom.

The key events here are: the out of Africa expansion and split into “basal” Northern European (NE) and Western Asian (WA) populations ~55kya; further population splits into the core ancestral populations of hunter-gatherers (EHG/WHG/CHG) and Anatolian farmers (ANA) 20-30kya; and subsequent population admixtures 5-9kya leading to the present-day Europeans. This graph is obviously a simplification of the true demography, but ancient DNA data clearly supports multiple large scale separations and mixtures in recent history. Each branch of the tree is also labeled with its effective population size, and you may notice that some branches exhibit much smaller populations than others. Drift and gene flow can thus compound: smaller isolated populations accumulating more genetic variation over the same time period and then propagating that variation through gene flow.
Background selection
In addition to these neutral confounders, a third non-neutral process indirectly shapes neutral variation: negative “background selection”. Background selection is the steady purging of deleterious alleles together with any neutral variation that resides on the same haplotype background:

Neutral alleles that, through bad luck, happen to be on a low fitness background, will be gradually pulled down in frequency even though they have no direct fitness consequence. The strength of background selection will vary across the genome, depending on the local recombination rate (the lower the recombination rate, the more distant deleterious alleles can have an influence on a given neutral site) and the rate/strength of nearby deleterious mutations. Background selection has two practical consequences. Over the long term, it can be thought of as a region-specific reduction in the effective population size or an increase in drift, because fewer haplotypes are “surviving” in the population. Over the short term, it also induces a covariance in the frequency of the neutral allele across generations, as shown in Buffalo et al. (2019) and the figure below:

Under background selection, an allele that decreased in frequency from generation 0-1 (Δp0) is also more likely to decrease in frequency from generations 2-3 (Δp2) as long as there is still deleterious variation on the background. This is not the case for drift, which is a random walk from generation to generation. Thus, alleles in regions under background selection will have more frequency changes over time and more covariance in those changes across serial measurements. When seeking to identify loci under selection, all of these processes need to be incorporated into the null model to avoid being fooled by the randomness of neutrality.
An alternative perspective: the coalescent
So far we have primarily discussed individual alleles, but it is also useful to think about how selection reshapes broader genetic relationships. For a pair of contemporary (or ancient) individuals, we can walk along the genome and estimate the time until they coalesce at their Most Recent Common Ancestor (MRCA)1. When an allele is under selection, it spreads more rapidly through the population, and carriers of the allele will have more recent coalescences than expected from drift alone. The figure below illustrates this phenomenon with simple genealogies:

Under neutrality, an allele will drift through the population and may gradually reach fixation based on pure luck (red). Whereas under positive selection, a strongly selected allele sweeps quickly through the population resulting in denser and more recent coalescent times (green) in expectation. Thus, local distortions in the coalescent distribution can be used as indicators of selection. As shown in the figure, background selection also influences the coalescent, because the branches with deleterious mutations propagate more slowly than those without. Regions under background selection will thus exhibit denser, more recent coalescences even though no positive selection is occurring. There’s no free lunch: coalescent-based models also need to distinguish selection from neutral drift, gene flow, and background selection by accurately estimating the global and local demography. And just as with allelic tests, the power of coalescent-based models no longer increases with sample size once the structure of the demography is accurately estimated in the time period of interest.
Selection in the past 20,000 years
As discussed in the prior post, Field et al. (2016) used insights from the coalescent to derive an elegant test for very recent selection (2,000 years) based on the density of rare variants (the Singleton Density Score or SDS). With additional modeling, the same intuition can be applied to identify less recent selection by estimating and evaluating deeper coalescences. Now let’s take a look at some of the largest studies using different data to detect selection in the past 20,000 years.
From modern data
Palamara et al. (2018) inferred coalescent relationships in >100,000 modern British samples and looked for loci with unusually low recent coalescent times as evidence of recent positive selection2. This statistic was estimated to have high power for selection specifically in the past 20,000 years. To estimate the null coalescent expectation due to drift and gene flow, the authors fit a distribution for their test statistic from putatively neutral regions of the genome. Which regions of the genome are actually neutral is unknown, but this heuristic is widely used in the literature. In total, the approach identified 12 genome-wide significant signals (across ~63,000 regions tested). Six of the loci were previously known and mapped to well-established genes for lactase (LCT), autoimmunity (HLA, TLR, IGH) and skin/eye pigment (GRM5, MC1R). The six novel loci did not contain obvious smoking gun genes, though they were generally involved in immune response. Thus, even with a massive data set we see relatively few traces of selection in the past 20,000 years. And what about confounding from background selection? This test does not explicitly model it beyond focusing on coalescences in the relatively recent time period. So even some of these loci may, in truth, reflect background processes.

From ancient data
Irving-Pease et al. (2024) also used a coalescent-based approach to look for unusual outliers, but additionally allowed for the inclusion of observations from ancient DNA samples. Rather than calibrate against putatively neutral loci, they derive an approximate likelihood for the observed allele trajectory versus a neutral one (see: CLUES and CLUES2). This likelihood ratio provides a formal test for selection, but depends on the (possibly strong) assumption that the population demography was inferred accurately by the model and that selection was constant and homogenous. When applied to modern genomic sequencing data from Europeans to look for selection in the past 15,000 years, zero significant loci were identified. The top ranked SNP, however, was in the well-established lactase/LCT locus, consistent with prior studies3. When applied to ~1,000 ancient European genomes, 11 significant loci were identified among variants that were previously identified in GWAS. Finally, when further stratifying the ancient data on local ancestry due to admixture, 21 significant loci were identified. Taken together, these findings suggest that ancient admixture/gene flow is pervasive and can act to dilute the historic influence of selection (more on this later). Still, even after accounting for admixture, the number of detectable loci was quite small, as had been observed from modern data and more recent time scales. And what about background selection? By testing specific alleles against neutrality, it is likely the case that background selection only adds noise (as was the case in their simulations). Less clear is the impact of errors in the demographic model, particularly if certain ancient admixtures or population changes were insufficiently represented in the cohort.
Le et al. (2022) likewise used data from ~1,300 ancient genomes to investigate selection with an allelic test. Specifically (following the approach of Mathieson et al. discussed in the previous post) each variant was modeled as a mixture of allele frequencies in ancestral mixing populations, and then tested for deviation from this expectation in a given time period. This directly accounts for gene flow, but what about drift and background selection? To account for this residual confounding, the authors exclude putatively functional regions and estimate a “genomic inflation” parameter based on how strongly the full distribution of test statistics deviates from the null. The reasoning is that most variants are presumed to be neutral, with any inflation in the median test statistic resulting from drift and other model violations; “controlling” for the inflation in the entire distribution (i.e. transforming the distribution so the median lies on the null) is then expected to isolate the true positives. The pros and cons of this approach are illustrated in the toy simulation below with a mix of drift and selection. When selection is strong, such that the selected alleles stand out clearly from the overall distribution, controlling for genomic inflation greatly reduces the false positive rate while losing a small number of true loci at the margin. When selection is weak, positives and negatives are scattered through the statistical distribution and indistinguishable, so genomic control gets rid of all signals. And when drift varies across the genome (e.g. background selection), the results can be a mix of true and false positives.

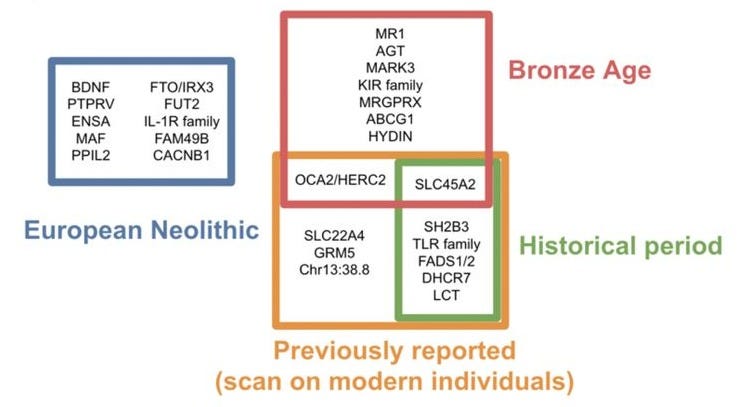
With those caveats in mind, Le et al. identified 25 loci with genome-wide significant evidence of selection, 11 of which had been previously reported. Each locus was further assigned to the epoch where it was significant, with a roughly equal number of loci across each period (though, the authors note, these results are driven by statistical power and should not be interpreted as an estimate of the total amount of selection in each epoch). The identified loci largely relate to diet (in the Neolithic), pigment and autoimmunity (in the Bronze Age), and again diet/metabolism (in the Historical period). Surprisingly, only a single locus showed significant evidence across all time periods tested: the well-established HLA/MHC region that has emerged in nearly every prior analysis. To the extent that these selection signals are accurate, they continue to be infrequent and stochastic through recent history.
From ancient data calibrated to modern data
The recent pre-print of Akbari et al. (2024) takes a completely different approach from prior selection scans and gets very different results. The study is exciting for several reasons: it carefully analyzes an enormous amount of new ancient DNA data from Eurasia; it uses a new model to scan for selection and a new model to establish statistical significance, neither of which require knowledge of demographic parameters; and it finds many more loci under selection than prior scans. So it is worth walking through exactly what was found and how. [The paper also has interesting results regarding polygenic selection using a very different methodology with different limitations, which I hope to discuss in detail in a future post].
Rather than attempt to model the local coalescent (as in Palamara et al. or Irving-Pease et al.) or the gene flow process (as in Le et al.), this study directly tests for an association between the frequency of each variant and the (historical) time that the corresponding sample was collected, where stronger selection is expected to produce a faster change in frequency. To account for drift and gene flow a Genetic Relatedness Matrix (GRM) is employed, which models the genetic correlations across all pairs of individuals in the study as a variance term or “random effect”. This data-driven approach has been widely used in GWAS to account for population structure (where the test is typically `trait ~ allele | GRM` rather than `allele ~ time | GRM`) but is introduced here for the first time to additionally account for temporal structure and drift. The key assumption is that pairwise genetic distances between samples can capture all of the excess variance due to the numerous confounding factors. If this approach works, it could be a major advance for the field in that it does not need a demographic model of any kind to control for confounding.
Does it work? Not quite. Applied to 8,433 ancient genomes (an absolutely massive new trove of ancient data, it should be noted) and 6,510 contemporary genomes from Eurasia, the statistics from the GRM-based model were still substantially inflated and did not match simulations4. Using these results as-is would have identified 8,210 loci under selection, which the authors deem implausible. On the other hand, applying the conventional genomic control (as in Le et al. and Mathieson et al.) would have identified just ~48 loci5, more than prior studies but not enormously so given the greatly increased sample size. Instead, the authors again chose to estimate a data-driven statistical threshold, this time by looking for consistency in modern association studies6. They observe that more significant selection statistics are enriched for trait associations in contemporary GWAS data (across 107 somewhat arbitrary biobank traits), and that this enrichment eventually plateaus (at a value of ~3.9x). This plateau is interpreted as the point at which the selection statistics no longer contain false-positives7. Using the plateau to rescale all of the selection statistics (dividing them by a correction factor of 1.67) produced a final set of 279 independent non-HLA loci at a 1% False Discovery Rate, an order of magnitude more than observed in prior studies and hinting at potentially thousands of loci across the genome (or as senior author David Reich put it recently: “the whole genome is seething with these changes in this period”)!
This correction is, to some extent, a leap of faith. The model assumes that GWAS loci are truly enriched for selected alleles and false positives are otherwise random. An alternative interpretation of the co-occurrence of selection and GWAS signals is that the regions of the genome that are enriched for false positive selection signals also tend to be the regions of the genome that are enriched for GWAS associations - i.e. the two tests are confounded. In fact, we know that this is the case at least to some extent due to the action of background selection, which locally increases the rate of neutral drift (inducing false positive selection statistics) and the amount of LD (inducing more GWAS associations through tagging) and tends to occur near important genes (which also contain more GWAS associations); see Berg et al. (2019) for more on this complex relationship. It is possible that the plateau is simply the point at which an (unknown) false positive rate stabilizes.

A key piece of evidence in support of the correction was that the resulting significant selection statistics were enriched for heritability of specific GWAS traits. In particular, basic biomarker and immune-related phenotypes were significantly enriched for heritability near loci under selection, with more significant selection estimates roughly tracking with greater enrichment (though with fairly wide error bars). On the other hand, behavioral/cognitive/psychiatric traits exhibited essentially no enrichment (with fairly small error bars), with the estimates actually tracking towards depletion for loci with more significant selection statistics8. You read that right, genetic variants influencing behavioral traits do not appear to be enriched for loci that are under selection. This is certainly an interesting finding and consistent with the variants identified in prior studies largely implicating basic immune and pigment processes. But it is hard to draw strong conclusions from the absence of enrichment, since behavioral traits also tend to have lower heritability on average and more of their own unique confounding. All enrichments also became statistically indistinguishable around a False Discovery Rate of ~50% (see error bars in the figure below), making it impossible to evaluate the validity of the critical 1% threshold that was ultimately used. In short, many moving pieces all have to fit into place for the results to be reliable.

How well do those 279 loci align with previous discoveries? The authors conduct a detailed comparison of their associations with those found in prior studies — including many of the studies I’ve discussed in this post or the previous one — and, well … it’s complicated. In one of the earliest and more conservative analyses, Mathieson et al. 2015 (which employed genomic control, described in the previous post) identified 12 loci, of which 10 were also significant (i.e. replicated) in this study. Notably, one of the two non-replicating loci was the OCA/HERC2 blue eyes variant, very likely a real instance of selection having been characterized in many prior studies (the other locus did not pass quality control). So the current approach may miss some complex selection processes but, at least when comparing to a very conservative analysis, the findings mostly replicate — pretty good! After that, the picture gets murky. Of the 22 testable loci identified from ~1,300 ancient genomes by Le et al. (which also used genomic control, as described above), just 9/22 replicate. When restricting to the three tested time transects, the replication rates are 1/10 (Neolithic), 1/7 (Bronze Age), and 5/6 (Historical); so nearly all of the replication is driven by the more recent data. For some loci, such as a variant that has a known protective effect against HIV, the findings of the two studies were diametrically opposite9. Of the 21 testable loci identified from ~1,700 ancient genomes by Irving-Pease et al. (which used a coalescent model, as described above), 13/21 had some evidence of replication. Of the 123 candidate loci identified from ~2,900 ancient genomes by Kerner et al. 2023 (using a simulation-based approach), just 14/123 replicate. Finally, turning to modern data, of the 3 loci identified by Field et al. (using a variant-based model, as described in the previous post) in a time frame that both approaches should be well powered for, 2/3 replicate (the usual suspects HLA and LCT). Moreover, after relaxing the threshold on the SDS statistic to pull in more nominally significant loci, only 1/34 of those replicated. In short, prior findings are very often not replicating with this new methodology and larger dataset.
What explains the lack of replication? The authors generally hypothesize that loci identified in prior work were false positives. If they are correct it would be a finding nearly as sensational as the new loci themselves; implying that a variety of widely used prior approaches have been spitting out false selection signals at a rate of 40-60%! A more tepid conclusion is that different data and methods currently disagree on what exactly is and is not under selection, sometimes strongly.
Selection in the past 50,000 years
To put these findings into broader context, let’s wrap up with a few large studies of selection reaching all the way back to the out-of-African migration.
Masked sweeps and weakening selection in ancient Eurasia
Souilmi, Tobler, Johar et al. (2022) analyzed data from ~1,200 ancient genomes looking specifically for evidence of “hard sweeps” — alleles that were selected all the way to fixation. What made this study unique was the focus on simulations to assess statistical power for detecting hard sweeps at various points in time using ancient and modern data. The simulations yield three important findings for Eurasian populations:
Modern genomes have adequate power to detect strong selection that persists after the major admixture events (8kya)10.
Both modern and ancient data have adequate power to detect detect sweeps that occurred prior to the population split (55kya)11.
However, modern/admixed genomes cannot detect sweeps that begin after the population split but do not persist after admixture. Theses sweeps are effectively “masked” or “diluted” by admixture and only detectable in ancient data from the un-admixed source populations12.
With this in mind, the real data showed evidence for 57 hard sweeps at a liberal False Discovery Rate of 11% (using a method that compares the frequency spectrum at a locus to that of neutral “background” regions). These sweeps occurred after the migration out of Africa but were already observed in samples older than 30kya, implying a strong and relatively old process. Yet, strikingly, only 2/57 were observed in modern genomes, leading the authors to conclude that these sweeps “have been almost entirely erased from descendent populations in modern Eurasia” (this phenomena was also observed in Irving-Pease et al. above but in reverse: after accounting for ancient admixture, more selection was found). Taken together with the simulations, one explanation is that selective pressure has “eased” in the past ~10kya13, with these ancient events erased by admixture and lack of persistent selection. This paints a surprisingly dynamic picture of our genetic history: variants that provide substantial fitness advantages do exist and periodically sweep up to high frequencies, only to be largely “erased” by gene flow and changing environments.
Beyond Eurasia
Nearly all of the previously discussed studies focused on selection within Eurasia, and relied on ancient DNA or sophisticated coalescent-based models. In contrast, detecting differences in selection between populations — sometimes called recent/local adaptation — merely requires the comparison of allele frequencies between modern individuals from those populations. Such studies were carried out decades ago, with Coop et al. (2009) being one of the more definitive analyses comparing African and non-African groups. Using genetic data from >50 different global populations from two studies, the authors sought to identify variants that differed substantially between them by more than would be expected from neutral variation. The study is foundational in our understanding of recent adaptation and was summarized by the authors so effectively that I will simply quote them here in full [Pritchard, Pickrell, and Coop (2010)]:
Overall, however, the HapMap data show relatively few fixed or nearly fixed differences between populations from different continents, implying that new alleles have only rarely spread rapidly to fixation within populations, even though there has been sufficient time for strongly favored alleles (selection coefficient, s ≥ 0.5%) to spread from low to high frequency since these populations separated. Nearly all of these rare fixation events have taken place outside Africa and, curiously, most are found in the east Asians, the group that has experienced the strongest genetic drift of the three HapMap groups. For example, there are just 13 non-synonymous SNPs in Phase II HapMap with a frequency difference >90% between the Yoruba and east Asians. Of these, only one is due to a high frequency derived allele in the Yoruba. Additionally, few of the east Asian fixation events are associated with strong haplotype signals, as measured by cross-population extended haplotype homozygosity (XP-EHH). This indicates that few of these alleles were fixed very rapidly. Instead, the XP-EHH data are more consistent with a steady, slow increase in frequency during the time since the out-of-Africa migration roughly 60,000 years ago. Finally, these putatively selected alleles can be grouped in a small number of geographic patterns that reflect neutral population structure; these geographical patterns have been described as non- African, West Eurasian and East Asian sweep patterns. The observation that sweep patterns mimic neutral population structure is not what might have been expected if the frequencies of individual alleles were strongly determined by environmental factors, such as climate or diet, that likely vary over different geographic scales. Additionally, looking across all populations, and all SNPs, there is not a single example of a SNP with very extreme allele frequency differences between closely related populations. At the level of individual SNPs, there is thus no clear evidence for extreme differential adaptation between closely related populations.

In short, there were very few instances of loci under rapid adaptation between continents and none for closely related populations — consistent with a model where environmental differences are not inducing rapid selective pressures. 2009 is a long time ago, with methods and data having advanced substantially since then, but this cross-population result has largely held up. For example, a recent coalescent-based analysis by Speidel et al. (2019) identified 35 distinct loci with evidence of selection across 20 global populations from the 1000 Genomes cohort; i.e. fewer than two per population.
Before Out-of-Africa
Finally, Mallick et al. (2016) investigated the hypothesis that the rapid changes in human culture and behavior over the past 50,000 years — the so-called “human revolution” —could be explained by rapid “species-wide” sweeps in the recent ancestors of modern humans. Specifically, they searched for regions of the genome with low frequency differences among modern genomes but large differences between modern and archaic genomes (Neanderthal/Denisovan, which split off from modern humans 300-800kya); as would be expected from a variant that drove key fitness changes and thus swept up to high frequency after the split. They found zero such instances, using two different tests. Instead, they speculate that environmental shifts have been the primary driver of change in human behavior14 or, perhaps, that there was no dramatic behavioral revolution at all (citing Mcbrearty et al. (2000)). Whatever the cause, a small number of sweeping variants did not make modern humans who we are.
So … where are the selective sweeps?
Most studies agree that instances of locus-specific selection typically influence phenotypes related to immunity, pigment, and diet with little to no instances for cognitive/behavioral phenotypes. Even the relatively liberal analysis of Akbari et al. found that selection does not seem to be focusing, on average, on variants that influence cognitive/behavioral traits in contemporary individuals15. Most of the studies also agree that there are few traces of very recent selection in modern genomes and very few unusually differentiated loci between continental populations. Where there is dispute is how to interpret the evidence from ancient genomes in Eurasia: Irving-Pease et al. and Soulimi et al. argue that there may be a few strong selective sweeps during the post-split / pre-admixture period but they have been “masked” by subsequent admixture events in conjunction with weakening selection. In contrast, Akbari et al. argue that there is evidence for hundreds or even thousands of loci under selection in ancient data and propose two explanatory hypotheses: that selection has fluctuated substantially over time and prevented alleles from reaching fixation between continental populations16 (or presumably, that environments have fluctuated, leading to changes in the influence of genetic variants on fitness); or that selection has been somehow qualitatively different (e.g. focusing on immune traits) and accelerating in the past 10,000 years, driven by major environmental and cultural changes17.
These hypotheses are difficult to test and do not yet fit together into one unified theory. If selection was accelerating, one would expect to see more loci under recent selection in modern data, for which we have very powerful tests and fewer technical challenges — yet modern genomes show hardly any loci under recent selection (Palamara et al.). If selection was fluctuating, one would expect it to be missed by the (essentially) linear model that was employed by Akbari et al. — yet the linear model implicates thousands of loci. Assuming fluctuations in selection are a frequent evolutionary response to environmental changes, one would also expect to see many loci deviating from the neutral drift between nearby populations (which often experience very different environmental/cultural pressures) — yet this is never observed in modern global data (Coop et al.) nor in comparison to archaic humans (Mallick et al.). Finally, various widely used methodologies still largely disagree on the individual selected loci they do identify.
Will better models show that much of what we think is selection is actually confounding from complex gene flow, background selection, and drift? Or will they reveal an even larger number of loci under fluctuating selection? Did we get so lucky that selection became linear and strong just in the period where we had sufficient data to test it? More data from other epochs, more ancient data from other populations, and — most importantly — more sophisticated modeling is needed to resolve these contradictions.
The coalescences across all observed individuals and loci can be stored in a compact data structure called the Ancestral Recombination Graph (ARG). Which can be thought of as a genealogy for each genomic region (after collapsing redundant sites where the genealogy does not change). Here is an example ARG from a recent review:

The ARG is an interesting and useful data structure that enables much more than just tests for selection, see Nielsen et al. (2024) for more.
A key innovation of this approach was the ability to estimate coalescence times from data with just common genotype variation rather than whole-genome sequencing, with only a small reduction in accuracy. Sequencing is expensive, and this enabled analysis of many more individuals, providing more accurate estimates of the recent demography (and thus higher statistical power). However, the lack of sequencing data means the method can only point to regions of the genome that appear to be under selection, and not specific alleles.
Interestingly, even this classic locus appears to exhibit some idiosyncratic timing, as recently highlighted by Vaughn et al. (2024): “For the MCM6 locus [regulating LCT], we find a significant increase in the lactase persistence allele beginning ∼6,000 years before the present. We note that this is thousands of years after the consumption of dairy began in Europe, as evidenced by milk fat residues discovered in potsherds dating back to at least 9,000 years before the present (Evershed et al. 2022). This gap, which has previously been noted in several studies (Itan et al. 2009; Mathieson et al. 2015; Burger et al. 2020), suggests that the selective pressure for lactase persistence was not in fact the initial domestication of animals and ensuing increase in lactose consumption, an observation that has led to significant speculation as to what this pressure may have been.”
“We turned to simulation, which suggests that the control factor for the nominal χ2 is 1.04. The nominal genome-wide significance threshold, corresponding to an adjusted P-value threshold of 5e-8 with CF=1.04, is p=2.7e-8, which yields 8,210 independent loci. The FDR for this threshold is estimated to be 44%, which is far more than the <1% that would be expected if the threshold was well-calibrated. Therefore, our simulation is not realistic enough and does not adequately adjust for all the artifacts contributed to false-positives in real data.” ~ Akbari et al.
“To adjust for residual confounding of our selection statistics, we tried adjusting with genomic inflation (λGC), defined as the median of the nominal 𝜒2 of the selection coefficient divided by the median of a chi-square distribution with 1 degree of freedom (0.455). This empirical correction factor is 5.26 for our dataset. We tried using the λGC as the control factor for the nominal 𝜒2 . The nominal genome-wide significance threshold, corresponding to an adjusted P-value threshold of 5e-8 with CF=5.26, is p=7.2e-36, which yields 48 independent loci, excluding the HLA region.” ~ Akbari et al.
“We tried multiple approaches to control family wise error rate (FWER). However, we found that these approaches are either inefficient or not robust. We used an alternative approach of controlling for false discovery rate (FDR) by leveraging high quality GWAS studies.” ~ Akbari et al.
“We find that the proportion of SNPs showing significant association to a phenotype in a GWAS increases dramatically with our selection statistic Z, plateauing at around 3.9-times the rate of overlap for random SNPs … This is the pattern expected for a true threshold for genome-wide significance: if SNPs beyond this threshold reflect a combination of true signal and false discoveries, we would expect enrichment to continue beyond it.” ~ Akbari et al.
“We confirmed that our X-statistics are detecting biologically meaningful patterns by showing that signals of selection are unusually associated with specific classes of traits. In particular, we find enrichment for SNPs contributing to blood-immune-inflammatory traits (95% confidence interval (CI) 2.6-6.8), compared to random SNPs with matched characteristics defining the baseline of 1-fold. In contrast, for mental-psychiatric-nervous and behavioral traits, we do not see enrichment (95% CI of 0.2-1.3 and 0.5-1.4).” ~ Akbari et al.
“We find that the allele was probably positively selected ∼6000 to ∼2000 years ago, increasing from ∼2% to ∼8%” ~ Akbari te al.
“Across the 3 epochs, we find no evidence for selection of this allele (p=0.55, 0.05, 0.34 for the EN, BA, and H epochs respectively) in line with the evidence from modern samples, despite previous reports of selection at this locus” ~ Le et al.
“After amending the model to allow the selection pressure to persist following the Holocene admixture events, we observed a dramatic increase in the detection rate of sweeps postdating the subdivision of Eurasian populations (that is, selection onset at 44 ka and 36 ka), with power being particularly high for strongly selected loci (s = 10%) across all admixed European populations (power between 65 and 85%; Fig. 5 and Supplementary Fig. 20). Notably, Modern Europeans achieved detection power exceeding that observed for any of the three ancestral source populations (Anatolian EF, Steppe and WHG) in nearly all cases.” ~ Souilmi, Tobler, Johar et al.
“Sweep detection power remained high in admixed populations whenever sweeps predated the split between the source population lineages, despite one of the source populations (WHG) having power close to zero under all modelled scenarios” ~ Souilmi, Tobler, Johar et al.
“We first investigated a model in which selection is active along all population branches that inherit the beneficial mutation until the 8 ka admixture event, at which point the selection pressure is relaxed … Our results clearly demonstrate that Holocene-era admixture can effectively mask historical sweep signals in the absence of any ongoing selection pressures: only the sweeps that precede the division of Eurasian lineages (that is, selection starting at 55 ka) could be detected with reasonable power both before and after the admixture events.” ~ Souilmi, Tobler, Johar et al.
“An intriguing implication arising from the simulations is that the selection pressure(s) underlying the sweeps may have eased during the Holocene period in some cases.” ~ Souilmi, Tobler, Johar et al.
“Thus, our results provide evidence against a model in which one or a few mutations were responsible for the rapid developments in human behaviour in the last 50,000 years. Instead, changes in lifestyles due to cultural innovation or exposure to new environments are likely to have been driving forces behind the rapid transformations in human behaviour in the last 50,000 years” ~ Mallick et al.
Here’s how senior author David Reich summarized it on a recent podcast: “If you look at traits that we know today affect immune disease or metabolic disease, these traits are highly overrepresented by a factor of maybe four in the collection of variants that are changing rapidly over time. Whereas if you look at traits that are affecting cognition that we know in modern people modulate behavior, they're hardly affected at all. Selection in the last 10,000 years doesn't seem to be focusing, on average, on cognitive and behavioral traits. It seems to be focusing on immune and cardiometabolic traits, on average, with exceptions.”
“The simplest way to resolve this paradox is to recognize that selection coefficients are unlikely to have been constant over time, even though we make this simplifying assumption to make it possible to detect selection … we find that around half of the mutations have true ages an order of magnitude larger than the expected sweep age, which means that selection coefficients on the alleles must have shifted over time.” ~ Akbari et al.
“An alternative explanation for this paradox is to hypothesize that West Eurasians have been experiencing qualitatively more and different natural selection in the Holocene than in earlier periods because of rapidly changing lifestyles and economies … this hypothesis is consistent with our evidence of particular intense selection for blood-immune-inflammatory traits, and our evidence that selection for these traits becoming even stronger in the Bronze Age than it was in earlier periods.” ~ Akbari et al.
You say there are few selective sweeps, but what do you compare with? Did humans have less selective sweeps that chimps or average mammal species at same time, or did humans at 55 kya had less selective sweeps than humans at 8 kya?
Thank you for this interesting post.
I don't know anything about statistical genetics so I probably misunderstood something, but I found this paper https://www.pnas.org/doi/pdf/10.1073/pnas.2213061120 also coauthored by Tobler and Souilmi (and others). In Table 1 (page 5), the authors indicate that one-third of the "genes inferred as under positive selection" are associated with neuronal functions. On page 4, the authors write: "Intriguingly, eight of the ten ancient Eurasian neuronal genes are associated with severe intellectual disabilities and developmental delay phenotypes in humans".
Also, in this preprint https://www.biorxiv.org/content/10.1101/2023.02.05.525539v2.full, the authors identified a "young peak of genetic variants arising at ~280,000 until ~2,000 years ago reaching a maximum at ~55,000 years ago". Then, they write that "genetic variants related to ‘Psychiatric’ phenotypes presented an evolutionary age younger than expected by chance (median evolutionary age = 412,639 years old), a class of traits suggested to be linked to human brain evolution."
How is this consistent with your claim that "Most studies agree that instances of locus-specific selection typically influence phenotypes related to immunity, pigment, and diet with little to no instances for cognitive/behavioral phenotypes"? Are these two studies wrong? Or did I just misunderstood everything?