
How population stratification led to a decade of sensationally false genetic findings
Stratification makes environments look like genes


Population stratification makes environment look like genes
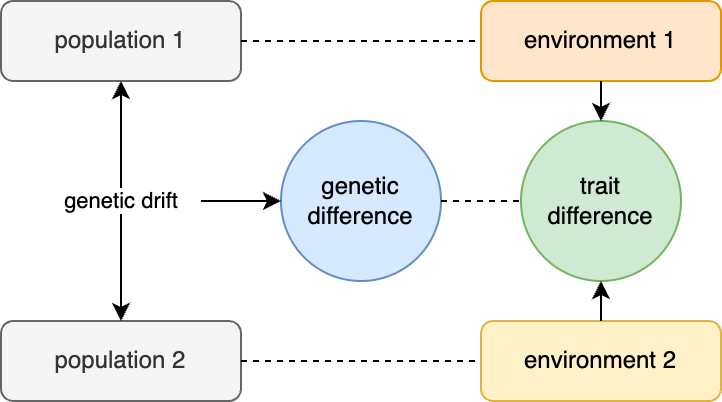
Controlling for population stratification (like its neighbor controlling for multiple tests) is the wet blanket of genetics research; the Debbie Downer that pulls the plug on the music at your party, turns up the lights, and has everyone start cleaning up the confetti. It is the reason given by Reviewer 3 when they just don’t like the paper and want to sink it — “populations stratification was not carefully controlled”. It is the question raised by the PhD committee when they haven’t read the thesis but need to make the student sweat — “how do you know this isn’t just all population stratification?”. It is such a recurring boogeyman that it can be easy to forget what exactly population stratification means. Population stratification requires two components:
First, you need population structure, which is the non-random distribution of alleles across individuals. Population structure is always present because humans do not mate randomly, and so some alleles will always be at slightly higher or lower frequencies in some sub-groups simply due to random fluctuations (aka drift).
Second, you need environmental differences between the populations that influence your phenotype of interest, which act as a confounding variable.
In the presence of both genetic structure and environmental confounding, we get population stratification — the apparent association between genetic variants and the trait of interest that have no true direct causal effect.
We can visualize this phenomenon with some simple simulation below, where two populations have slightly different allele frequencies and a phenotype that differs between them for purely environmental reasons. Let’s say the two populations are Northern (orange) and Southern (red) Europeans and we are running a genetic association study (GWAS) of height, which tends to be greater in the North. With enough statistical power, the GWAS will identify all of the alleles that are slightly more common in the North (where people are taller) as “height increasing” and all of the alleles that are slightly more common in the South as “height decreasing”; whether they actually influence height or not. If we then use these “height” weights to build a genetic predictor of height for a completely new set of European individuals, the predictors will seem to show large genetic differences in height between the two groups. And these differences can grow very large as more variants are used in the predictor, since the stratification will always point the same way and accumulate. We thought we were training a predictor of height, but we actually trained a predictor of ancestry/environment that also happens to be directionally oriented with observed height. Not great. And because this is a predictor of environments, it will be correlated with all of the other environmental differences between Northern and Southern Europeans. So not only have we turned an environmental difference into one that looks like a much larger genetic difference, but we start to think that eating pasta or being a fan of Fellini movies or head size is also linked to a genetic propensity for lower height.
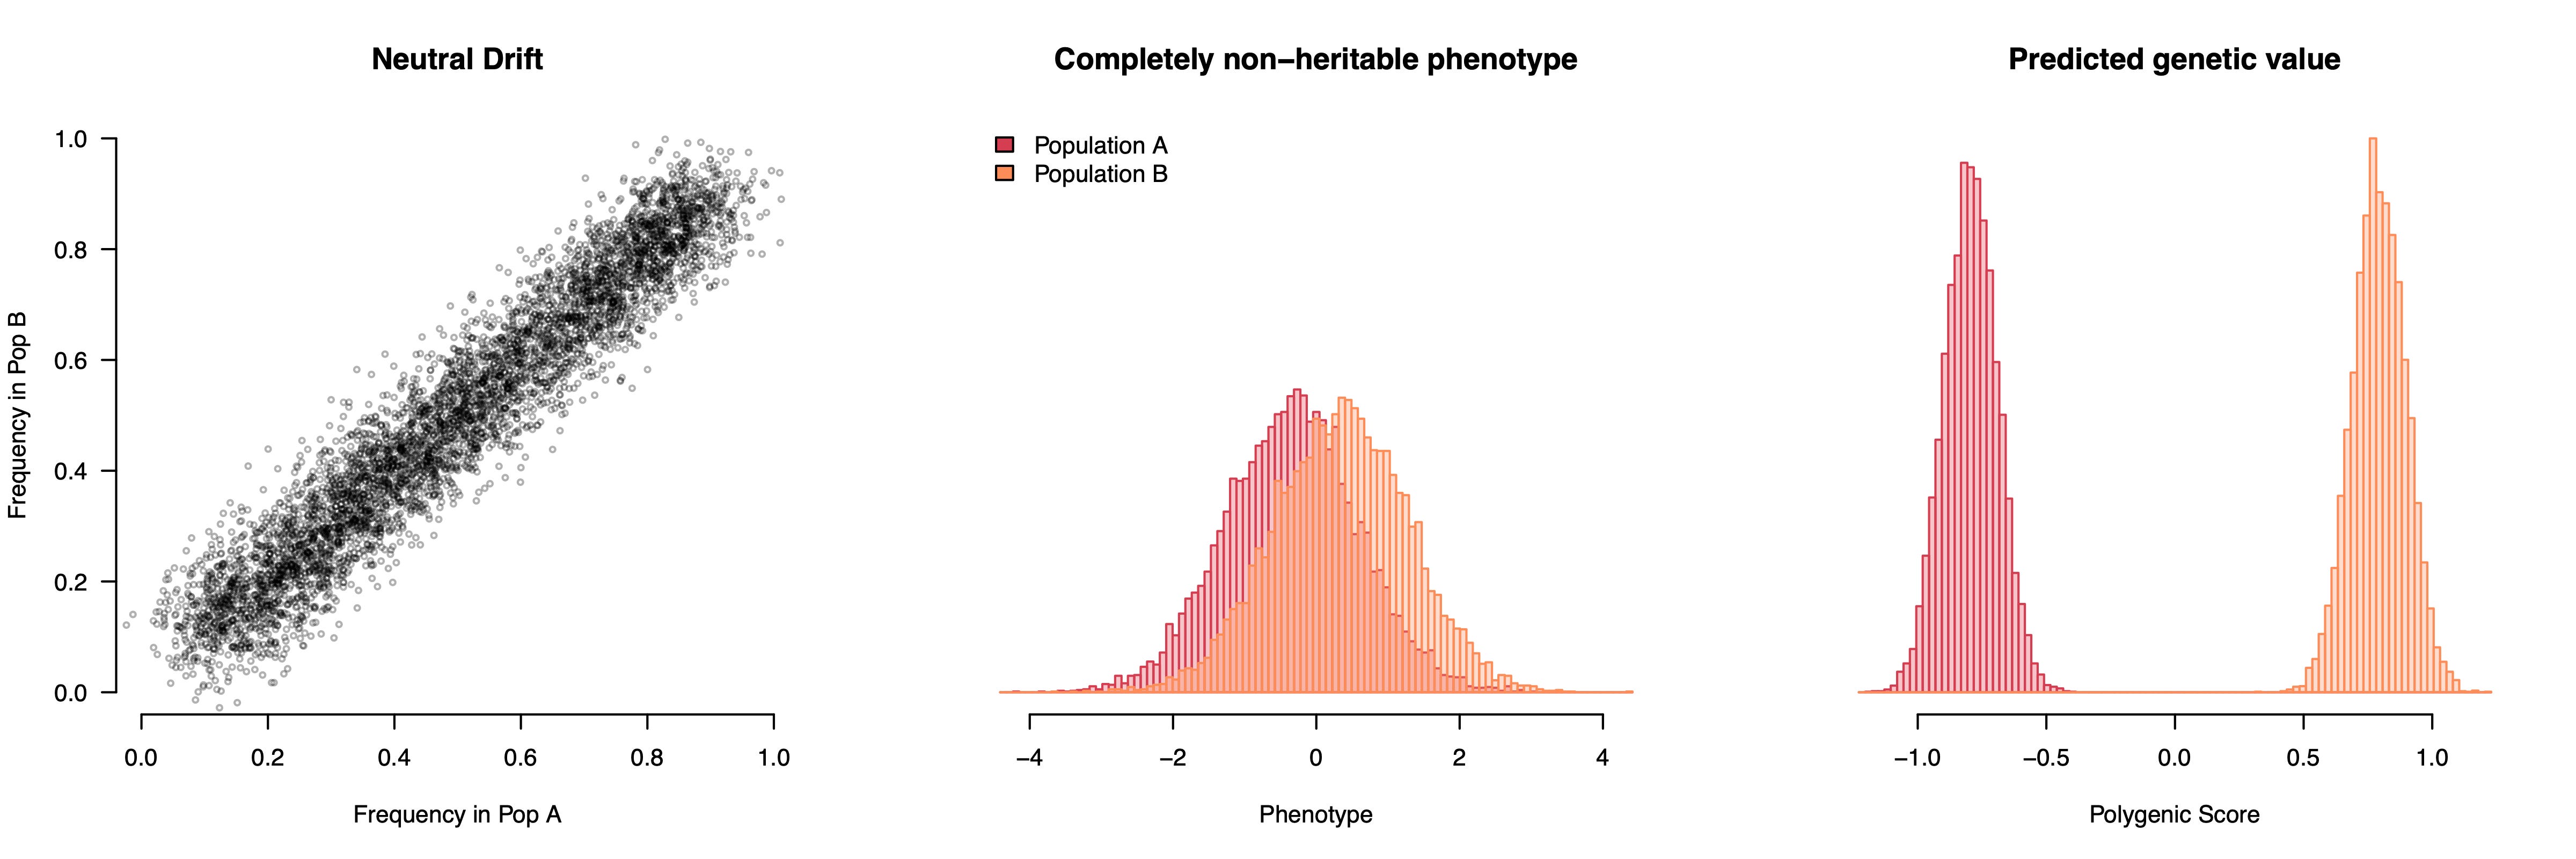
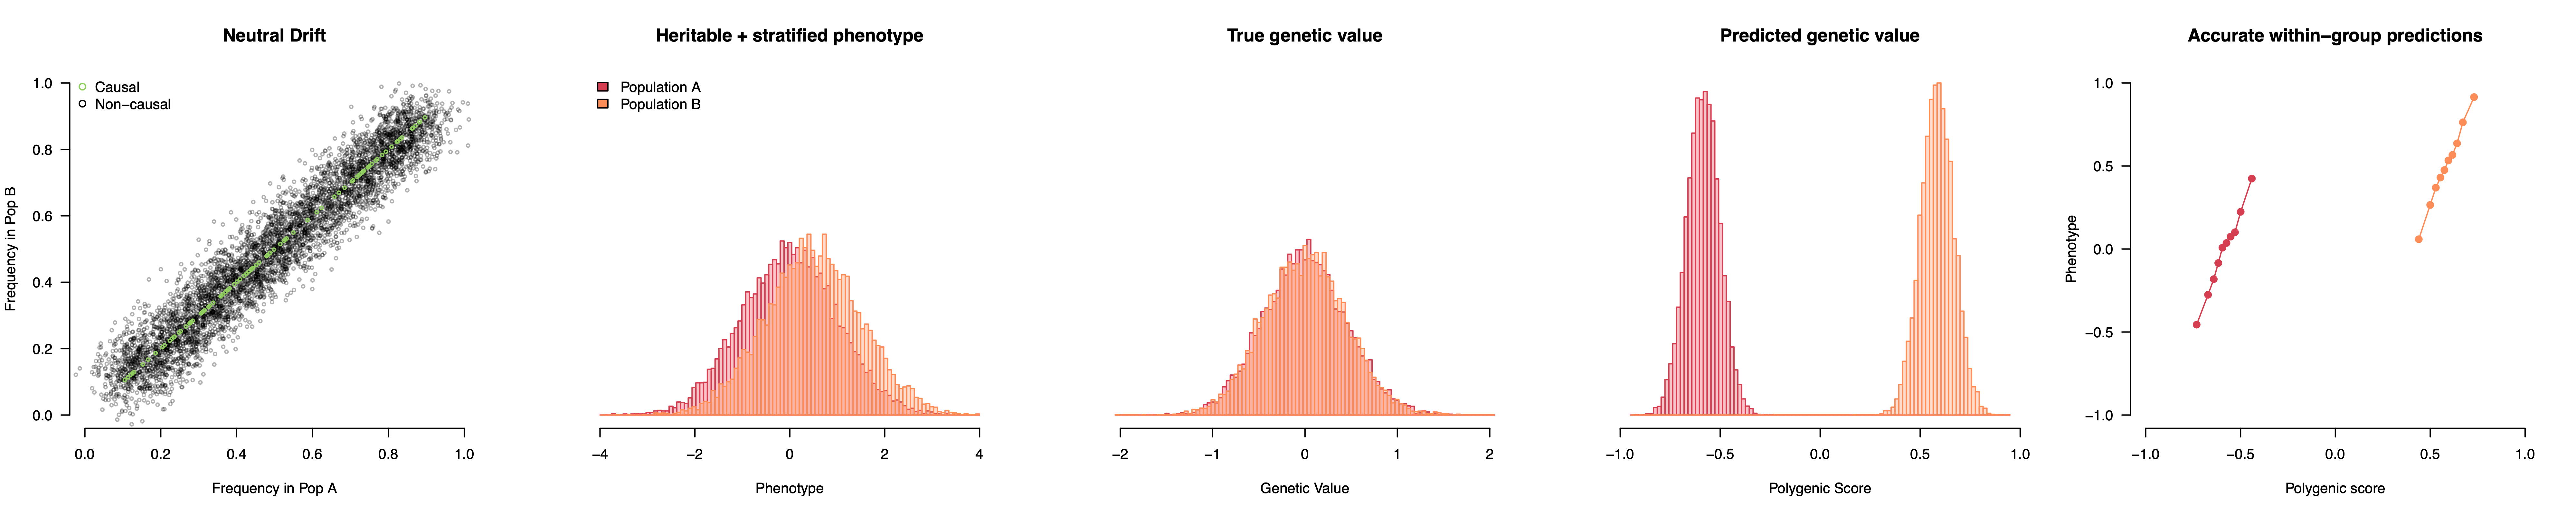
This simulation uses a completely non-heritable phenotype, but we can also add some causal variants that do not differ between populations. Now we have a genuinely heritable trait with an environmental difference but still no genetic differences. The GWAS will pick up a mixture of stratification, which drives the population means apart, and true causal variation, which predicts inter-individual variation within populations. The resulting polygenic score thus looks like it’s working properly while actually showing vast genetic differences between populations — differences that do not actually exist. The worst part is that even though population structure itself is random, the GWAS orients all of that structure to match the phenotypes we actually observe, which makes the (false) genetic findings appear eerily plausible: genetically taller in the North and shorter in the South just like we see with our eyes! People sometimes ask why population stratification would just happen to line up so well with what we see phenotypically, but that is exactly what population stratification does: it lines up random genetic fluctuations with the observed phenotype in a way that then persists in independent samples.
This height example might seem far-fetched, but pretty much exactly what I described actually happened, and it led to a decade-long mess where the field was convinced that Europeans had undergone rapid natural selection on height (and other phenotypes correlated with height like … head circumference) only to learn in 2019 that it was all or nearly all explained by stratification (see Berg et al. and Sohail et al. eLife; or press coverage that concludes “this is a major wake up call … a game changer”). But prior to learning this error, the possibility of selection on head circumference got people speculating what else about the head could be under rapid recent selection. That speculation included an famous opinion piece by esteemed population geneticist David Reich raising concern that genetic analyses may soon reveal substantial biological differences among human populations on traits like intelligence; differences that we as a society were unprepared to grapple with1. Naturally, in some circles, Reich’s cautious and circumscribed warnings that we may eventually find challenging genetic differences were read as a kind of Straussian message, a cryptic admission of precisely the “racist prejudices and agendas” Reich was attempting to head off (and, I should note, that he spent another two chapters in his book explicitly denouncing). Snippets from his editorial were further stripped of context, sometimes reworded entirely, and became meme fodder for open racists: Harvard’s superstar geneticist is secretly on our side, the truth about the inferior races will soon be revealed. And these memes continue to get passed around today, more than five years since the motivating height result was shown to be an artifact (in a paper on which Reich is a corresponding author no less). All of which is to say that poor control for population structure can have, well, some pretty big consequences.
Stratification is pervasive for environmentally stratified traits
The above examples were simulated, but how much of a problem is population stratification in real GWAS? Turns out it can be a big deal, often even overwhelming the actual trait-influencing variation. And it is a particularly big deal for precisely the traits you might imagine: those that are related to education and socioeconomic status and thus under strong social stratification. Two recent pre-prints highlight this issue by making use of data from family-based GWAS. Recall that family GWAS first subtracts out the within-family genetic component (e.g. the parental or sibling mean genotype) and then conducts an association study on what is remaining. Since population structure (as well as other environmental confounding) is expected to act on the entire family unit, it effectively gets subtracted out as well.
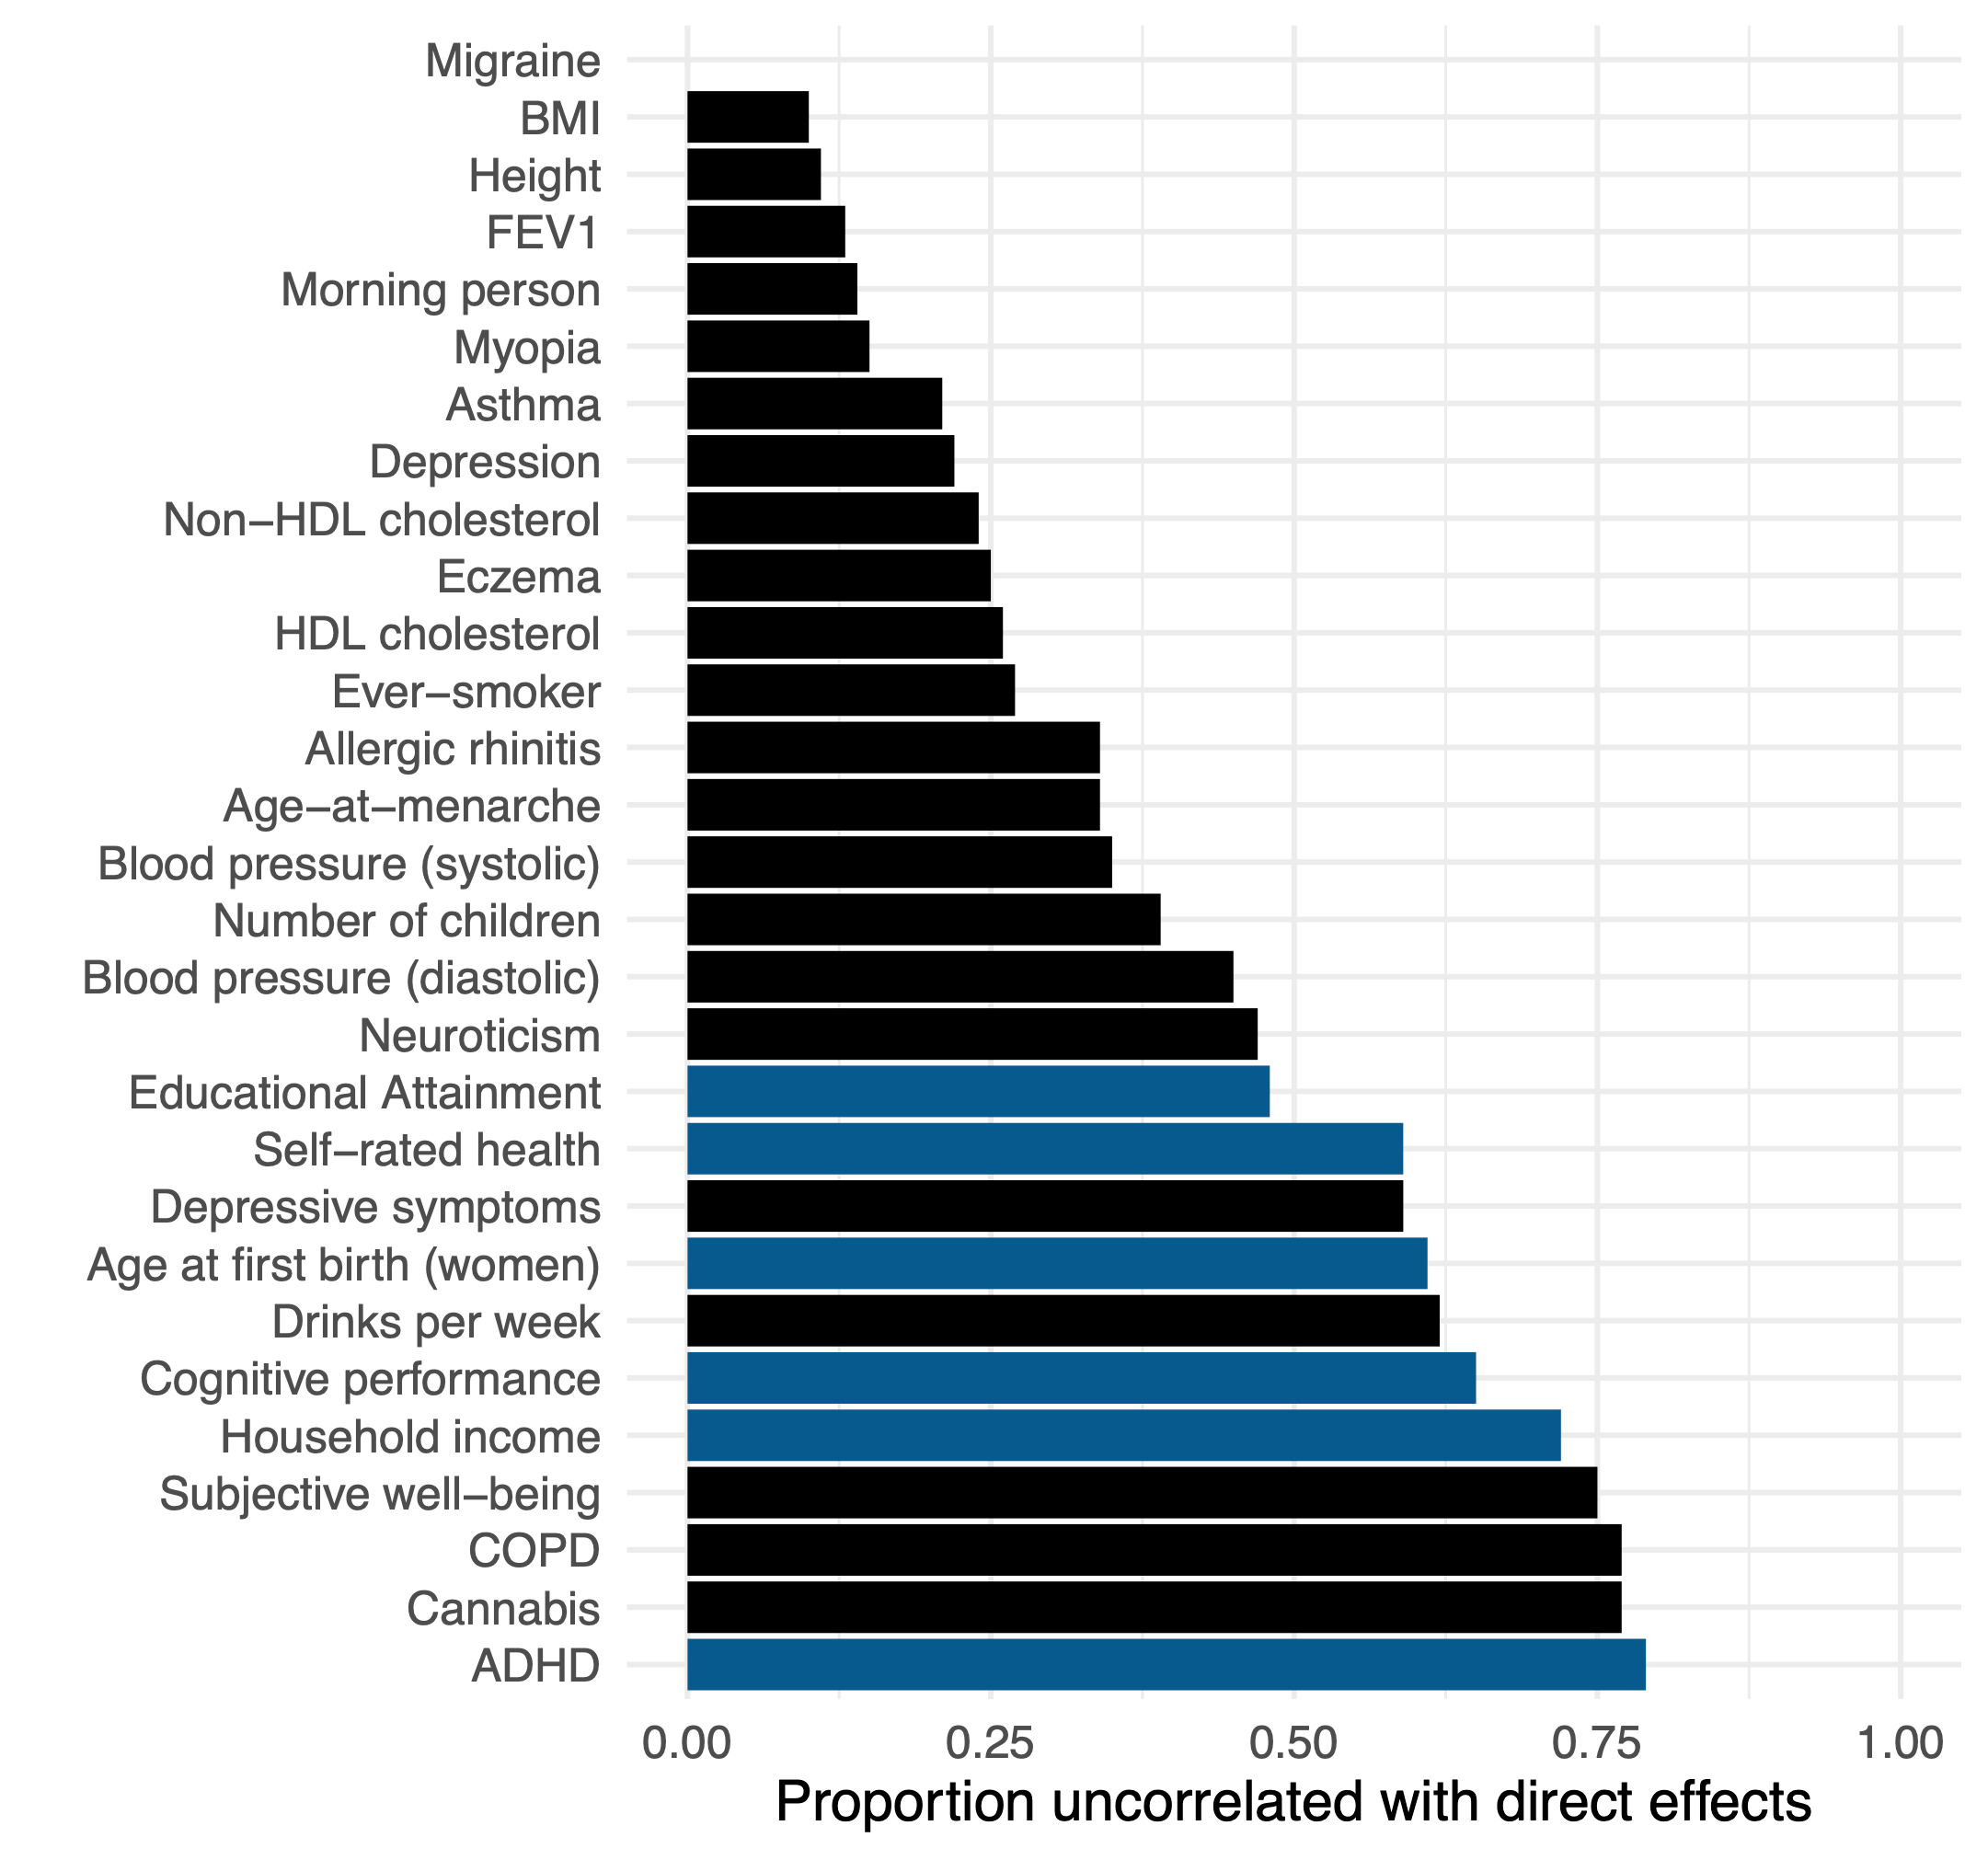
The recent study of Tan et al. (2024) (which I’ve written about previously) conducted a large family and population GWAS across a variety of common traits. For every variant, this produces two statistics: the population-based effect sizes with confounding, and the family-based effect sizes with much of the confounding removed. They then developed an estimator of the similarity between these two sets of effect sizes after accounting for random sampling noise due to sample size. On average across traits, they find that ~40% of the effect estimated in the standard GWAS is uncorrelated with the family GWAS (i.e. likely to be some form of confounding). The range was even more revealing, traits like height and BMI showed ~10% confounding, whereas traits like cognitive function, income, and ADHD exhibited >60% confounding.
Though this estimate confirms that population GWAS of social/behavioral traits exhibit substantial confounding, it does not directly implicate the source. To try to get at this question, the authors conduct a second analysis estimating the genetic correlation between the population and family GWAS effects using a method — LD-Score (LDSC) regression — that is less susceptible to simple forms of population stratification. When simple population stratification is accounted for with LDSC, the remaining population-family effect correlation is quite high: 0.9 on average (compared to 0.56 obtained from an alternative approach that does not account for stratification). The authors conclude that the higher LD-score regression estimate is an indicator that stratification is “largely the major cause”2.
This triangulation across methods is important evidence of stratification, but it is still circumstantial. Fortunately, recent work by Smith et al. (2025) proposed a method to connect population-family effect differences directly to components of genetic ancestry. The approach is very intuitive: they treat population GWAS effect sizes estimates as a sum of family effects, estimation noise, and some uncorrelated component that includes confounding (which they cheekily refer to as “SAD effects” for Stratification, Assortative Mating, and Dynastic effects):
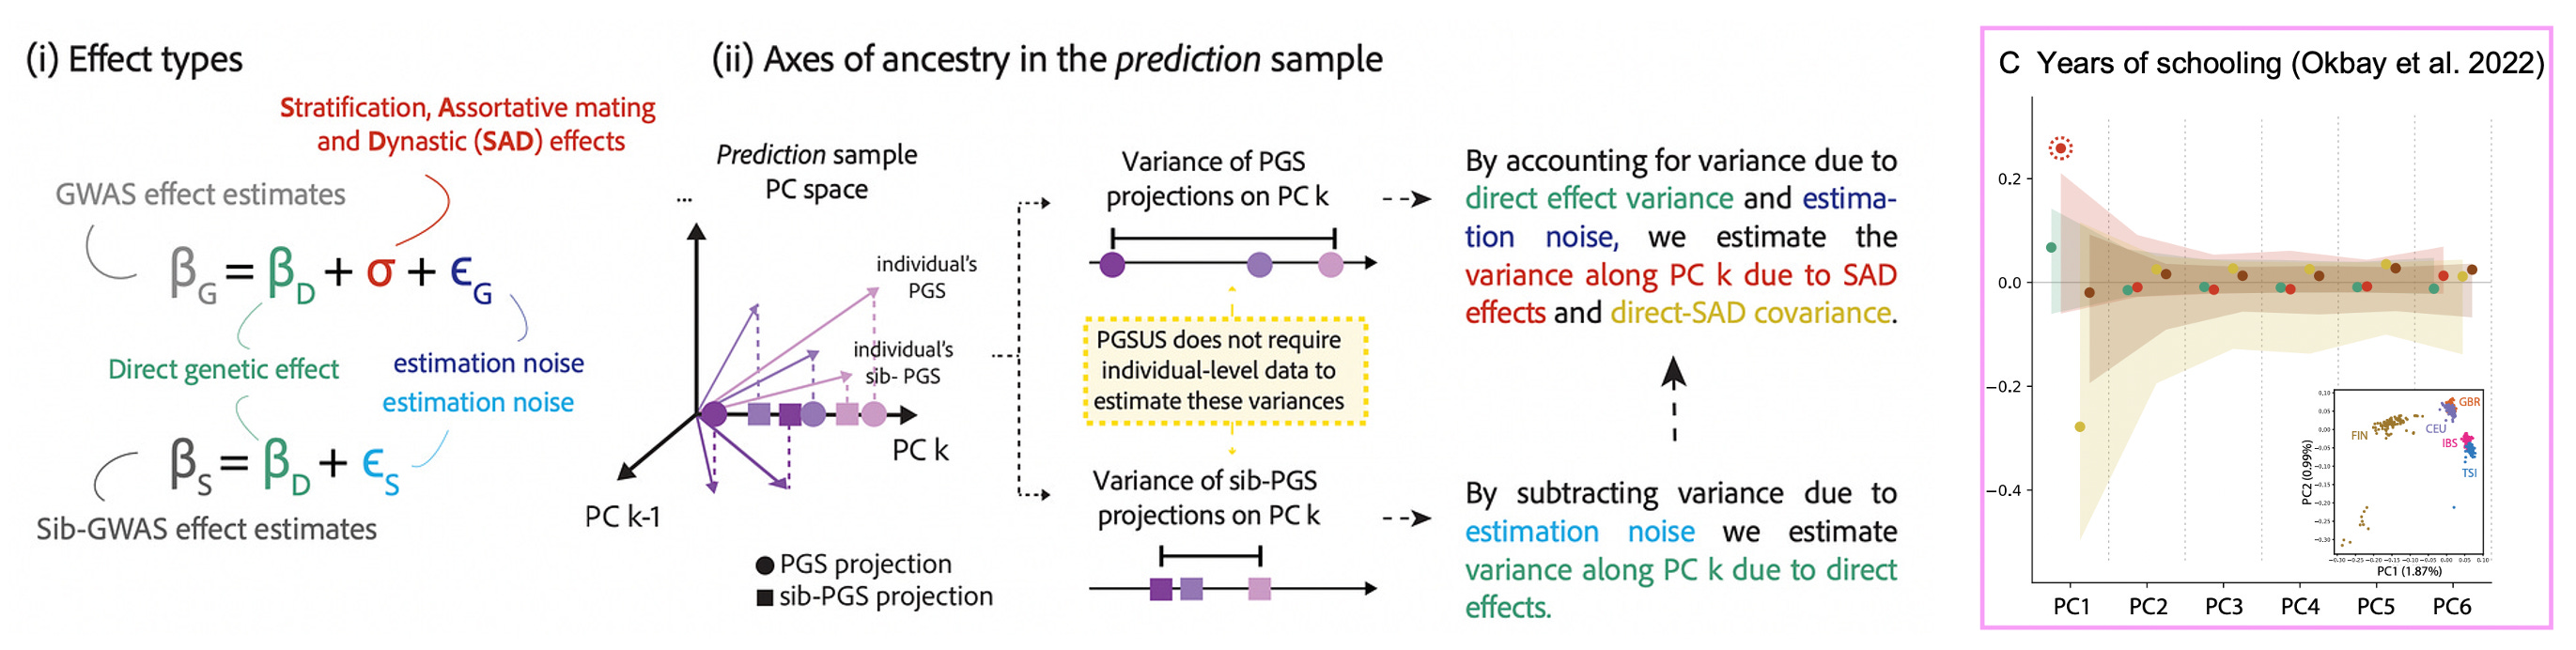
By contrasting the population and family estimates, the method can extract the SAD effect component and then — this is the important part — test whether it is correlated with genetic ancestry components (including genetic ancestry estimated in other samples). A SAD effect (i.e. a difference between population and family estimates) that also correlates with ancestry is very likely to be stratification. Applied to a large recent study of educational attainment, the authors indeed find significant SAD effects along the major ancestry component that correlates with Northern vs. Southern European populations. In other words, the typical GWAS strategy of restricting to a “homogenous” European population and controlling for ancestry components did not work. Intriguingly, they also find that stratification from European training data can even be observed in non-European samples3 as well as in ancient DNA. Finally, through the magic of family data and clever statistics, we have close to definitive evidence of population stratification in large-scale GWAS.
Stratification induces arbitrary differences between groups
Okay, there’s a lot of stratification in real data for socially relevant traits, but how does this translate into false positives? Perhaps the simplest wrong thing one can do is use GWAS data to derive polygenic score weights, predict these scores into different populations, and look for mean differences. This is sometimes referred to as the polygenic score “portability problem” and it has multiple causes:
As we saw in simulations, any unmodeled population stratification will recapitulate environmental differences as if they are genetic differences in the score. The more variants in the score the larger the differences can appear.
Even in the absence of stratification, polygenic scores largely rely on non-causal “tagging” variants rather than causal variants (which are difficult to distinguish). These tagging variants will exhibit differential noise, frequency, and tagging across populations and lead to population-specific bias in the score. These are sometimes referred to as “MAF/LD” biases (Minor Allele Frequency and Linkage Disequilibrium) and they are a major cause of the reduction in accuracy of scores (see Wang et al. (2020) for quantification).
Polygenic scores constructed from one population will not capture the contribution of variants that are at lower frequency or absent in that population, leading to population bias in the target population. This is especially true when the genotyping arrays are biased towards one population, as is often the case (see Kim et al. (2018) for details).
Even family-based GWAS can induce an unusual ascertainment on the training population: selecting for families that participate and restricting to variants that are heterozygous in the parents. In the context of gene-environment interactions/heterogeneity the resulting scores can be biased in unpredictable ways (see Veller, Przeworski, Coop (2024) for details). Paradoxically negative direct/indirect effect correlations have been observed in many real studies and suggest such ascertainment is a genuine problem.
The combination of these factors makes the estimated mean uninterpretable in an external population: an arbitrary sum of predictive signal, noise, and bias.
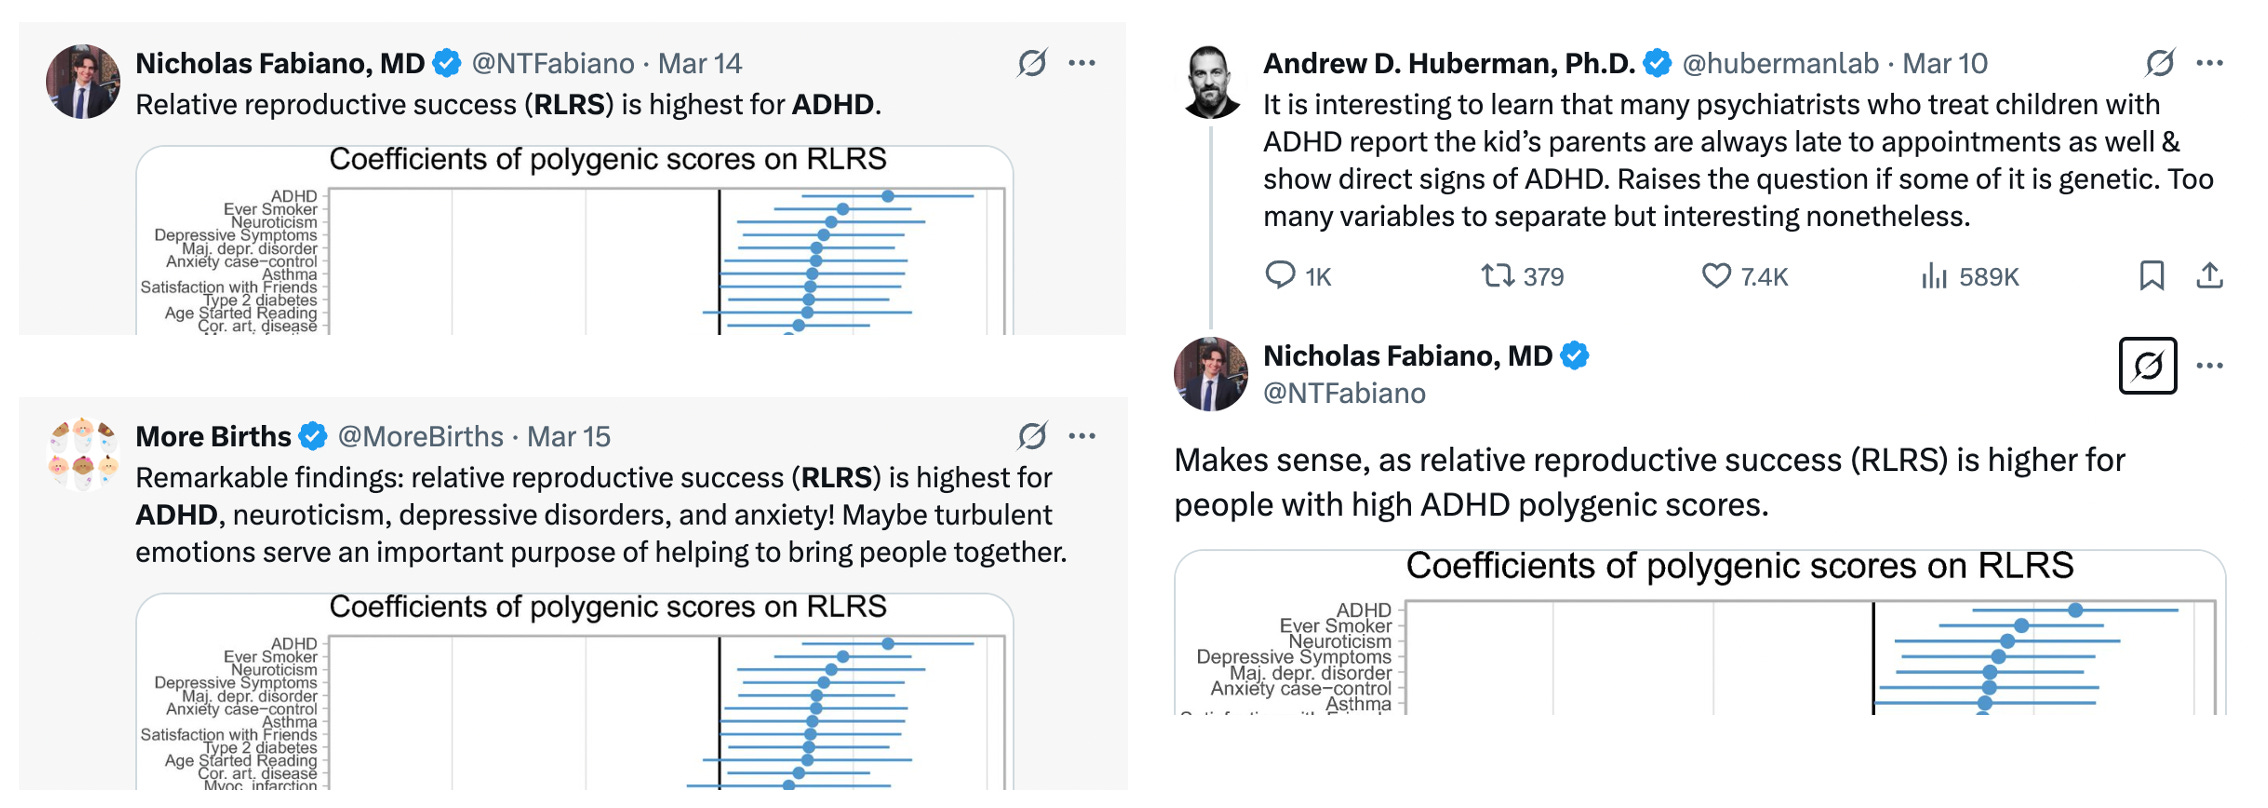
Dozens of papers have been written about the portability problem and why one should not compare polygenic score means across different populations4. Nevertheless, the results of an erroneous analysis can serve as a teachable moment. And while the polygenic score means are uninterpretable, contrasting the means estimated using population versus family GWAS data can give us a feel for how sensitive cross-population analyses are to stratification (with other portability issues still biasing family GWAS score mean). So let’s take a look. We will start with ADHD, the trait that exhibited the largest fraction of confounding in the Tan et al. study. Not only was ADHD heavily confounded (79% based on the figure above), but both the population-level and within-family heritability estimates were essentially zero (0.005 and 0.003 to be exact) so we can treat the resulting polygenic score as very close to a “null” score with little to no actual direct genetic influence having been detected [Update: to clarify, ADHD is a useful null trait from this specific GWAS study, which is likely an outlier. There is ample prior evidence of genetic variants associated with ADHD both individually and in aggregate. In general, we should expect nearly all traits to exhibit some non-zero genetic component]. We will use standard methods to build polygenic scores5 from the population and family GWAS of ADHD, predict these scores into public data from the 1000 Genomes populations and plot the predicted means for five broad population groups:
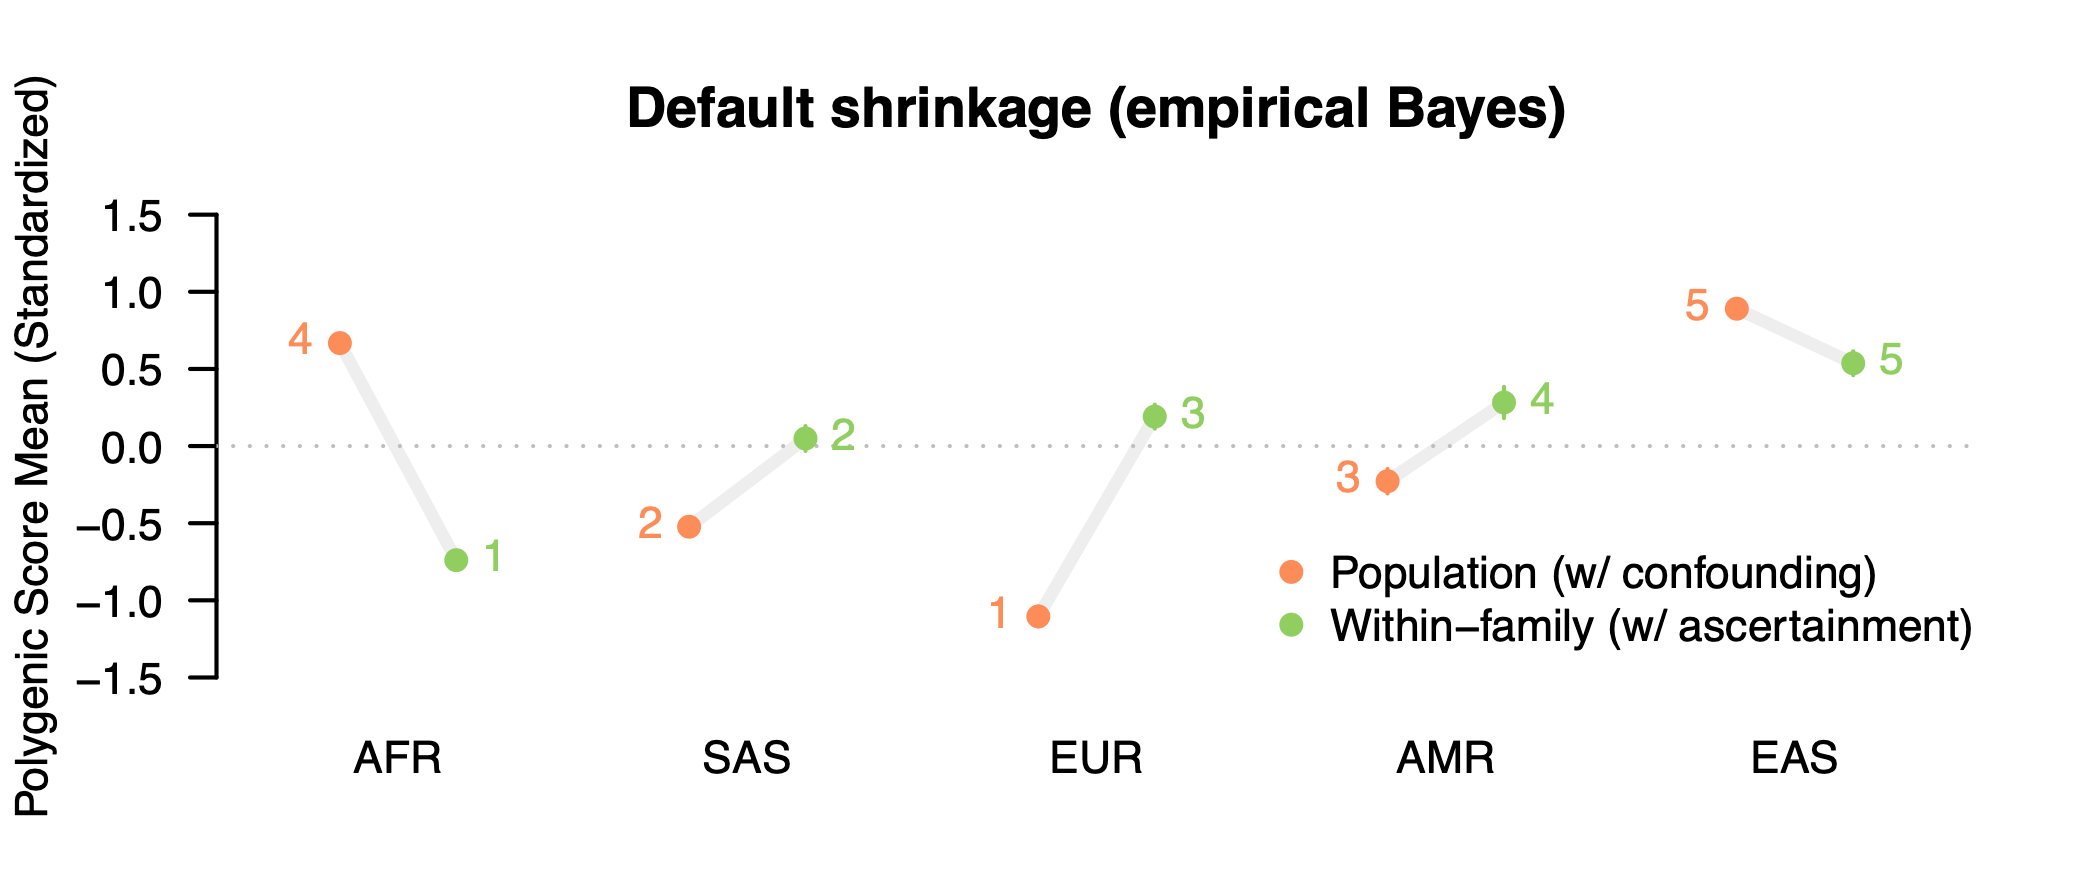
What do we get? First, our intentionally selected null trait still produces highly significant differences across populations when using the standard/population GWAS weights (orange): nearly a standard deviation lower than the global mean in the European sample and more than half a standard deviation higher in the African and East Asian sample. Is this evidence that Europeans have a lower mean genetic liability for ADHD? Certainly not. We know the score has ~zero predictive accuracy. What we are seeing are the accumulated effects of portability biases. This bias becomes even more apparent when we contrast with polygenic scores constructed using the family GWAS weights (green). The population means change drastically: the African mean goes from nearly highest to the lowest, whereas the European mean goes from lowest to the middle, with all differences being highly significant. In total, four out of five populations complete flip direction from being above/below the global mean! The family-based weights, which are still just picking up other sources of noise/bias, tell a completely different story.
What if we use a score that does have a significant genetic component, do these problems go away? Let’s run the same experiment with the GWAS data from Tan et al. for IQ / Cognitive Performance, which was estimated to exhibit a substantial amount of confounding in the population (~60%) while also having some statistically significant heritability (12-19% depending on how you estimate it). Now that we are comfortable with the setup, we will also expand the analysis to evaluate three different parameter settings for constructing the polygenic score (which requires a “shrinkage” parameter for how much to penalize the learned weights for noise): the default empirical Bayes approach that learns from the data, a high polygenicity parameter, and a low polygenicity parameter (all taken directly from the documentation).
As in the analysis of the ADHD null, we see a great deal of instability for genetically predicted Cognitive Performance scores. With default parameters, the population GWAS score places the European group significantly above all others, with the African samples falling in the middle. With family-level data, this is significantly reversed: the African samples are ranked the highest for genetically predicted Cognitive Performance — nearly a full standard deviation above the global mean — while the Europeans are ranked in the middle.
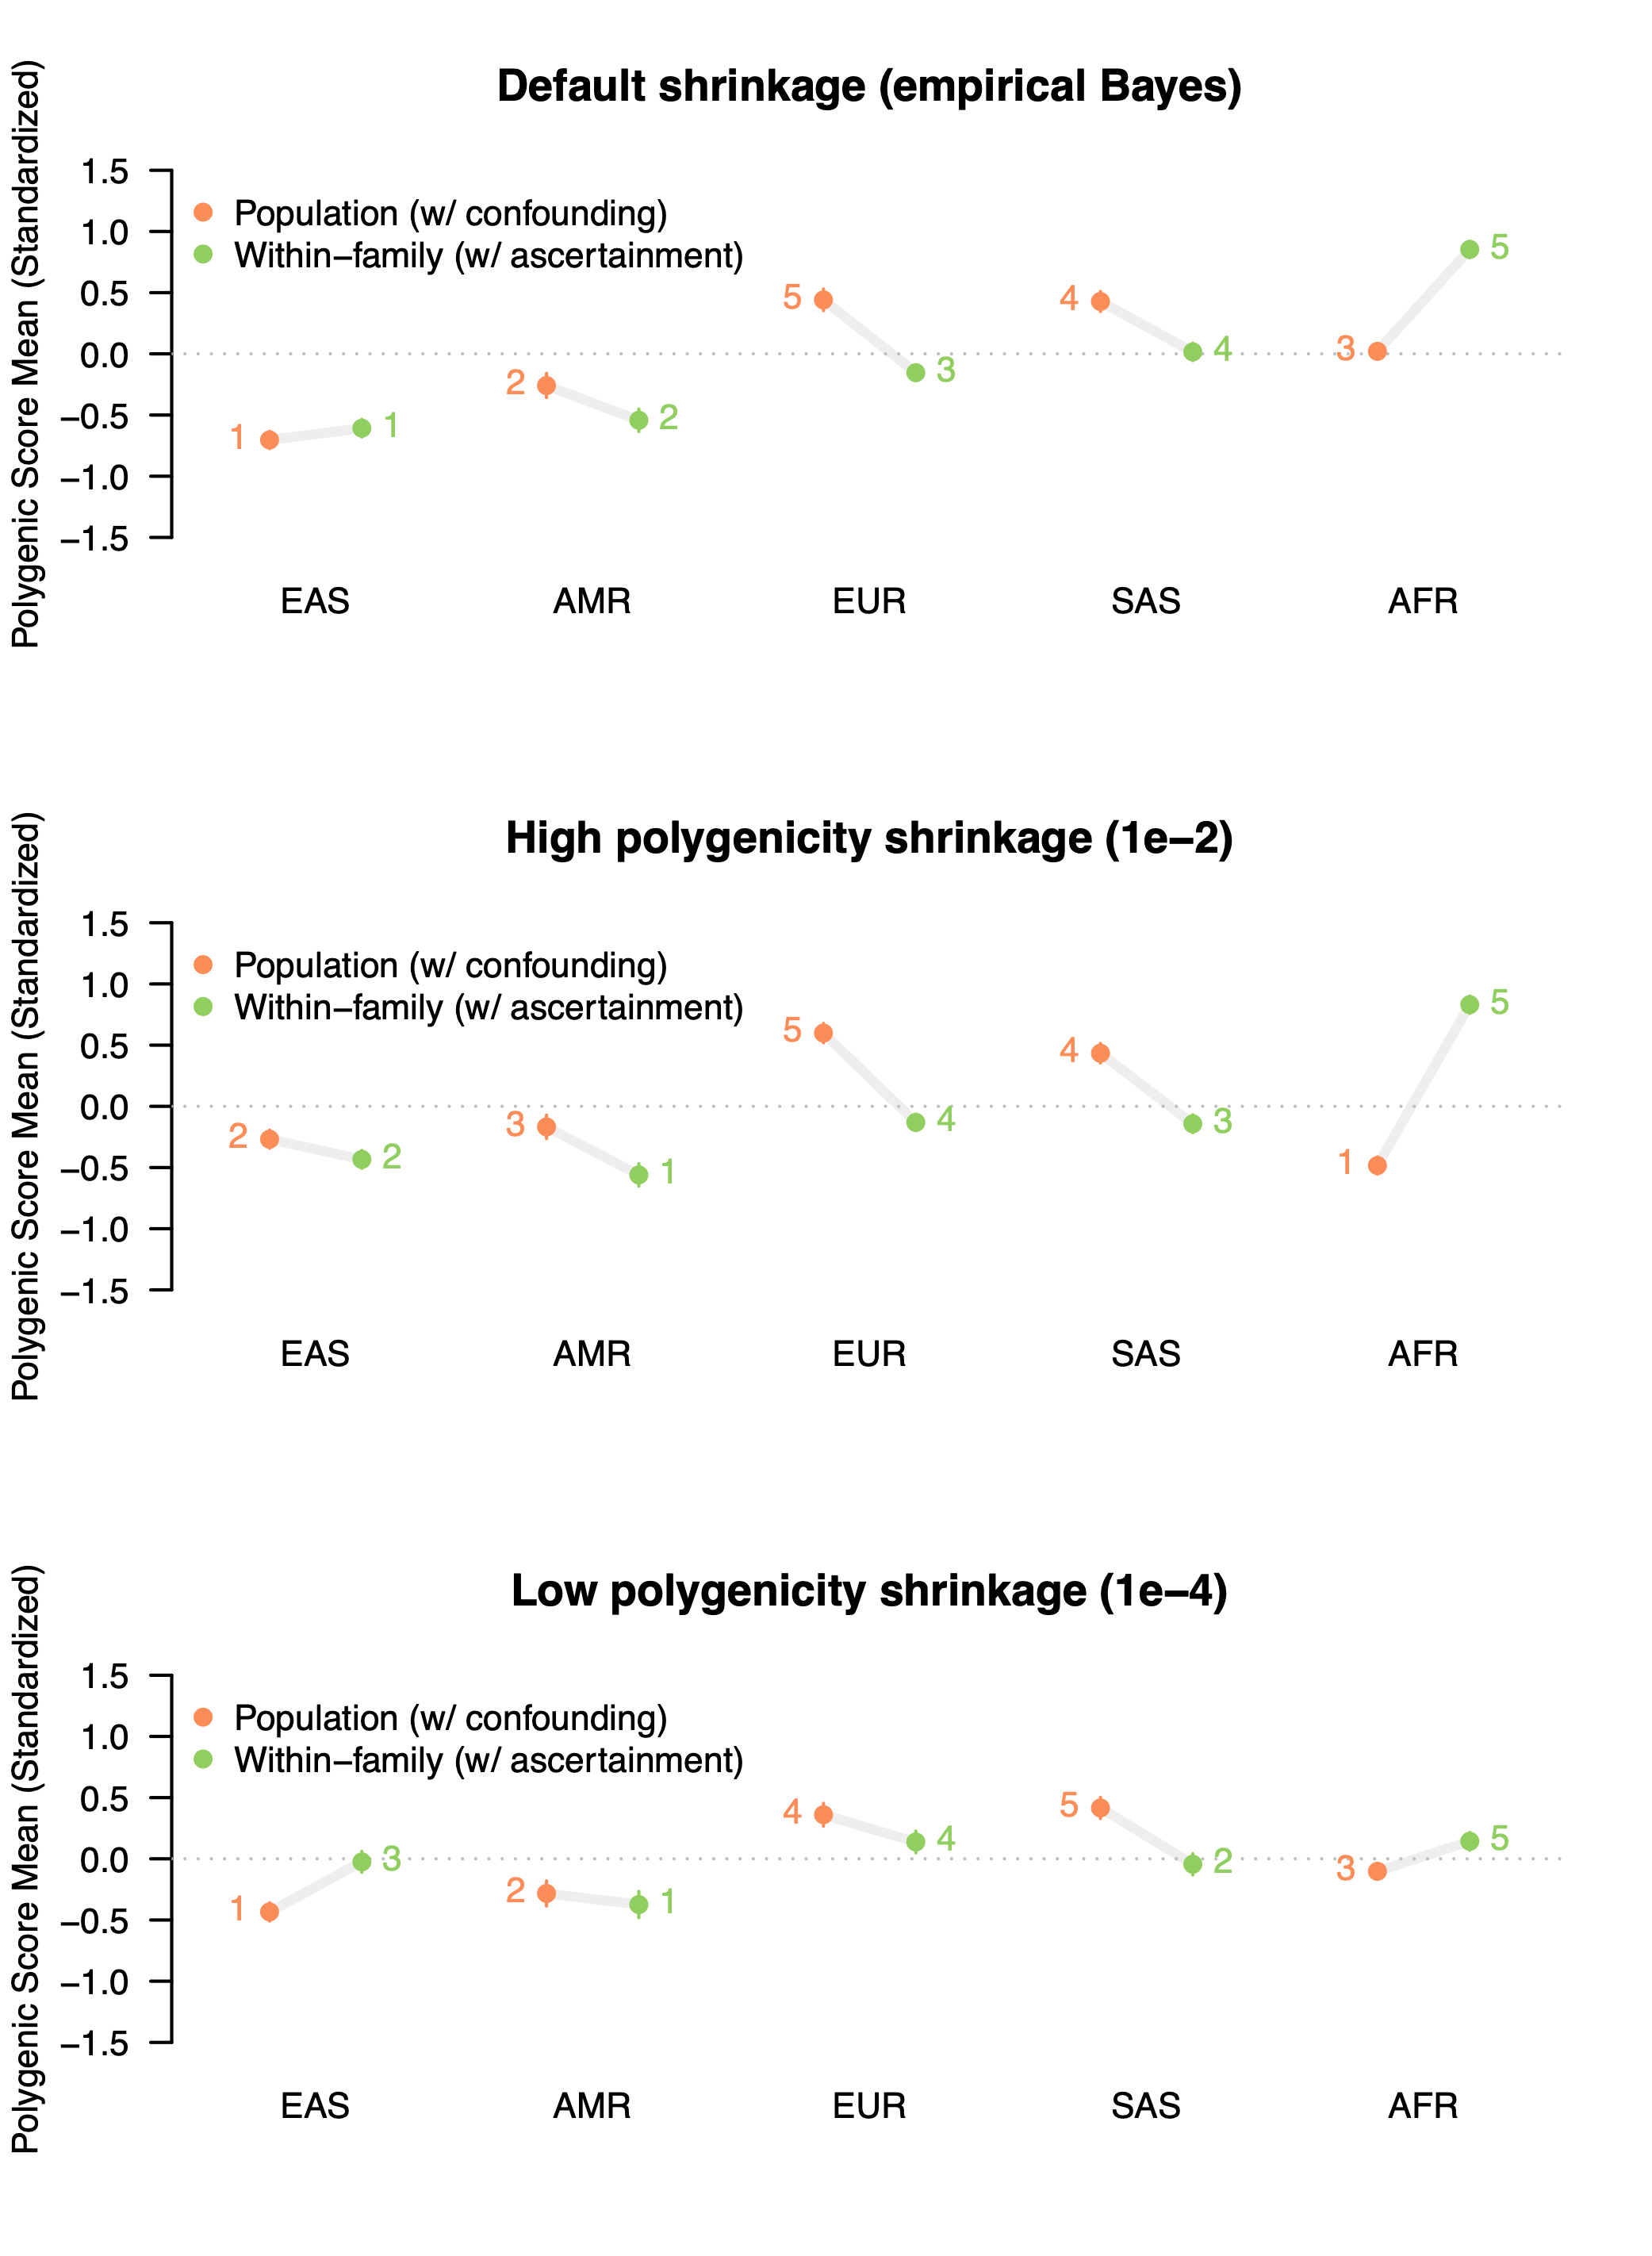
Even worse, when we fiddle around with the hyper-parameters used for fitting the polygenic score, the results change yet again. When a “high polygenicity” shrinkage parameter is used to build the population-level scores, the African sample is now ranked lowest instead of in the middle. The same is even true for the family-based estimates, which change substantially in rank across the different parameter settings. While the empirical Bayes approach is the method default, there’s really no a priori way to know which parameter is appropriate for a given disease architecture. And that is just one of many parameters that can be tuned. In short, it’s a mess!
Although none of these estimates are accurate due to the portability problems described above, by comparing population and family based polygenic scores we can see that the results are highly unstable even when a single set of training data and a single set of testing data are used. A motivated misinterpretation of these results could spin out all sorts of evolutionary stories about innate 1SD higher cognitive function in Africa due to warm climates, the cognitive demands of the harsh desert, the lack of Neanderthal introgression, etc and so on. Worse, a careless (or nefarious) researcher can easily tweak the underlying hyper-parameters to get whatever story they want (and let’s be honest, even a careful reviewer will likely not realize the critical importance of a statement like “we set \phi to 1e-4” in the Methods section).
Stratification distorts estimates of selection within groups too
Okay, I think I’ve made my point that stratification and portability is a problem when comparing across global populations. Don’t do it. Don’t trust papers that do it.
But there is a more subtle analysis that can suffer from population stratification and yet remains widely used: the association of polygenic scores with individual reproductive success (e.g. number of children) as a test for extremely recent natural selection. This approach, popularized by the studies of Beauchamp (2016) and Kong et al. (2017), hypothesizes that a higher genetic score in people with more kids is evidence that the variants influencing the corresponding trait will increase in frequency in the next generation, i.e. be positively selected. These analyses typically focus on polygenic scores related to — you guessed it — educational attainment, which is strongly environmentally correlated with number of offspring in many populations. And indeed, multiple such analyses have now found that polygenic scores for education tend to be significantly lower in individuals with higher reproductive success, arguing that this is evidence of negative selection against educational attainment.
As noted in Beauchamp (2016), however, it is not enough for the phenotype alone to be correlated with reproductive success, to support the claim of natural selection, the genetic variants influencing the phenotype need to be correlated with reproductive success6. And this is where the approach runs into the stratification problem. The whole point of using a genetic score is to focus on genetic causes7. Yet we know from Smith et al. that population stratification within European ancestry individuals is a substantial contributor to the educational attainment polygenic scores; and we know from Tan et al. that this is likely true of social outcome GWAS more broadly. We also know from theory and simulations that stratification will lead to a genetic score that is correlated with the phenotype for non-causal environmental reasons. So the significant relationship between the polygenic score and reproductive success may in fact be entirely explained by stratification, and this relationship will tend to go in the same direction as the environmental differences we see with our eyes. Environments looking like genes. Or, in this case, like natural selection.
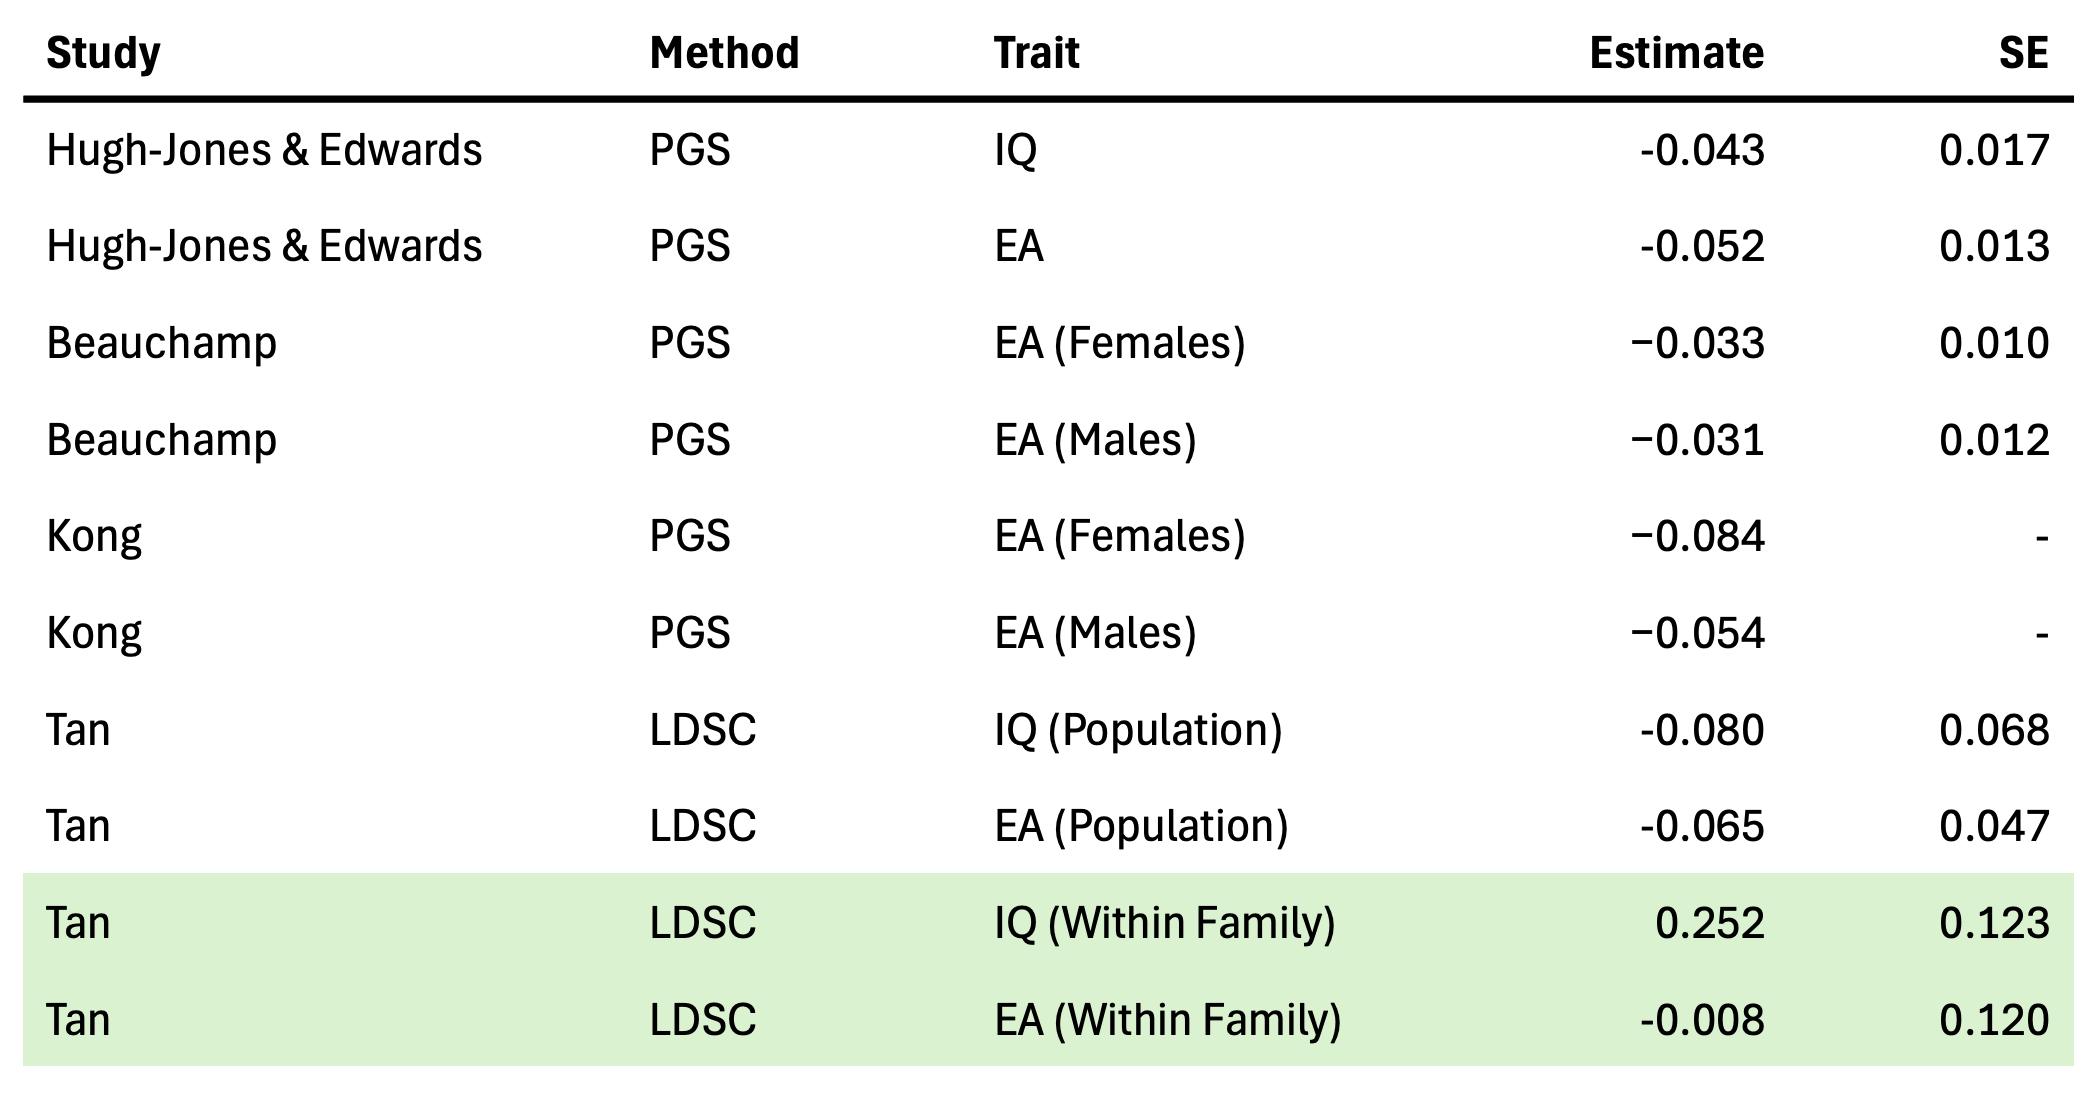
So is selection actually occurring or not? Instead of looking at confounded polygenic scores, an alternative approach is to use the LDSC method described above to estimate the genetic correlation between reproductive success (e.g. number of children) and other traits using family GWAS data. A high genetic correlation implies that the variants that increase the number of offspring also tend to increase the secondary trait, and would be consistent with a model of natural selection (though LDSC does not address all forms of confounding). Fortunately, Tan et al. included number of children as a phenotype in their family GWAS, providing us with the data we need (and reproduced in the table above). For educational attainment, they find no significant genetic correlation with number of children and a point estimate at roughly zero (though with large uncertainty). But for Cognitive Performance / IQ scores, they do find a significantly positive genetic correlation with number of children. That’s right, positive. The same variants that appear to increase cognitive performance also appear to increase the number of offspring (implying, if all of the model assumptions hold up, that higher cognitive performance may actually be under some amount of positive selection). Not only is this the complete opposite of what has been observed in prior analyses from polygenic scores, it also runs counter to the environmental observation. Have we stumbled on a paradox? Not quite, as Beauchamp also noted in a commentary about his own findings:
First, there is nothing paradoxical about my findings. Phenotypes arise from the interplay of genetic and environmental factors, and environmental factors can induce phenotypic changes that run counter to those induced by natural selection. Although the slightly lower fertility of individuals carrying genetic variants associated with higher EA [educational attainment] implies that natural selection has been slowly favoring lower EA, countervailing cultural, economic, policy, and other environmental factors are almost certainly responsible for the vast increase in average EA observed in the past century.
It turns out that this view may have been conceptually correct but directionally wrong. When stratification is better controlled, there appears to be no direct genetic relationship between EA and fertility. And if natural selection is acting at all, it is slowly favoring higher Cognitive Performance. This is not yet a definitive answer — the Tan et al. / LDSC results still come with substantial statistical uncertainty and model assumptions — but it is clear that as we do a better job of addressing stratification, the results can change completely.
More recently, the conventional polygenic score / reproductive success correlation analysis was applied to a wide number of traits in the US by Hugh-Jones & Edwards (2024). As before, the broad finding is that polygenic scores are negatively correlated with reproductive success roughly in proportion to their correlation with educational attainment. The authors connect their results to various economic theories of fertility/income trade-offs — it is indeed an interesting social science question! But the extent to which these associations are not simply capturing stratification remains unknown, and given everything we now know about these phenotypes the likelihood seems high. One particular finding stood out and was noted in the Discussion — “the most significant, positively selected trait was ADHD” — and was somewhat sensationally picked up by popular commentary:
ADHD … the trait that appears to have the greatest amount of GWAS confounding and essentially zero direct GWAS heritability. What a remarkable coincidence.
Edit: An earlier draft incorrectly cited Hugh-Jones & Edwards (2024)
“Recent genetic studies have demonstrated differences across populations not just in the genetic determinants of simple traits such as skin color, but also in more complex traits like bodily dimensions and susceptibility to diseases. For example, we now know that genetic factors help explain why northern Europeans are taller on average than southern Europeans … I am worried that well-meaning people who deny the possibility of substantial biological differences among human populations are digging themselves into an indefensible position, one that will not survive the onslaught of science. I am also worried that whatever discoveries are made — and we truly have no idea yet what they will be — will be cited as “scientific proof” that racist prejudices and agendas have been correct all along, and that those well-meaning people will not understand the science well enough to push back against these claims.” ~ David Reich, New York Times
“The correlations estimated by snipar thus give a better measure of how different genome-wide summary statistics on DGEs and population effects would be in the absence of sampling error, whereas LDSC gives a better measure of how correlated DGEs and population effects would be after adjusting for sampling error, local LD, and some component of population stratification. Differences between the two estimates can therefore be informative about the contribution of population stratification to confounding in GWAS, with higher estimates from LDSC suggesting a contribution from population stratification.” ~ Tan et al. (2024)
“For example, a PGS constructed for body mass index (BMI) showed no evidence for PC-specific SAD effects when applied to 1KG Europeans (File S1). Yet in the full 1KG sample, we detected significant SAD variance on PC1, which in part tags differentiation between 1KG European and non-European samples (Fig. 2F).” ~ Smith et al. (2025)
To minimize researcher degrees of freedom, I used the same polygenic score construction approach described in Tan et al: PRScs with default parameters and a European reference panel. All analysis code and results are available in this repository.
“In parallel, a number of recent studies have sought to examine the association between lifetime reproductive success (LRS)—the number of children an individual ever gave birth to or fathered—and various phenotypes in contemporary human populations. … However, this literature has analyzed the relationship between phenotypes and LRS, and natural selection occurs only when genotypes that are associated with the phenotypes covary with reproductive success. This literature’s conclusions regarding ongoing natural selection are thus particularly sensitive to assumptions that are needed to estimate the relationship between genotypes and phenotypes and to the inclusion in the analysis of all correlated phenotypes with causal effects on fitness.” ~ Beauchamp (2016)
“Recent advances in molecular genetics now make it possible to look directly at the relationship between LRS and genetic variants associated with various phenotypes, thus eliminating those potential confounds.” ~ Beauchamp (2016)
Respectfully, I see several perhaps fundamental problems to this kind of research, although I admit the post is really good:
1.- There is no causal model, no theoretical model using the dependent variables, with few exceptions, exceptions in which causal models are probably incomplete enough, like Height, to explain relatively small differences in it across individuals and populations. We know a lot about the Biology of things like Growth-Hormones, and some diseases like short stature or truly outstanding large ones. And the causality in those cases is easier to find because its effects are really large: they can be seen just by looking at people having those diseases.
2.- As such, doing correlational research, empirical research, without a causal model, a scientific one, looks to me like a fishing trip, even if outwardly can be justified as trying to build those models from correlations, like inspirational sources for at some point have a Scientific Theory to go along expectations and experiments, instead of having one before even designing experiments. But unfortunately, so far, I think it is not only fair, but accurate to say those correlations seem to be all over the map: from the positive, to the negative, to the non-existent, and worse: and back to a previous category, apparently. Typical observations of publishable research fishing trips...
3.- I see caveats in the heritability interpretation of some of the results:
a) Until deep into the 20th Century most progeny, most descendants, died before reaching the tender age of 1-10yrs of age. At least half, my guess is probably larger, but there are prominent disagreers with better credentials than me, and there is the issue child cadavers tend not to be well preserved in a relatively adequate time frame to study child mortality across History, let alone preHistory, and with such information studying the Evolution of things like reproductive success will be lacking, so there is a source of uncertainty which will never go away. But such kind of points to me Evolution/Natural Selection probably until around 100yrs ago had little influence on Genomes to increase some of the hypothetical outcome variables, including reproductive success.
b) Comparisons of reproductive success with something else does have a Historical Comparison Problem, maybe even an anchoring problem: Until recently most Families had way more descendants than now. So correlating reproductive success even with genetics now, will suffer perhaps the same lack of explanatory and predictive power History many times has: things changed, and as such, a Scientific Theory cannot be made because it will lack the explanatory and predictive power to include Reproductive Success in the past. It would be at best an incomplete theory.
c) Brain analogies to explain academic achievement, socio-economic class belonging, and IQ, done through a bigger brain narrative, for example, do have a strong negative selection in the disparity between a baby´s head and a woman´s birth canal, and complications arising from other stuff like spontaneous abortions, premature deliveries, placenta related diseases, etc. And such has changed too: nowadays fatalities or disabilities as outcomes of pregnancy and delivery are measured in parts per thousands. My guess in the past they were more frequent, but off my memory I don´t have a number. And it probably has the same problems as b). Even infections during pregnancy causing product fatalities or neonate disabilities has changed a lot too. It seems a moving target so to speak to me.
Things I think makes the existence of a Scientific Theory, not Humanities Models more important, more needed before doing and publishing research like this one. Sociology is not a Science, Psychology and Psychiatry are not Sciences either, even if Encyclopedias and a lot of people say and worse, claim they are.
They are not, they are Humanities and as such, they are outside of Science and its Methods. They use Hermeneutics not Logic nor Science to create narratives with explanatory power in the Hermeneutical meaning of Explanation, not in a Scientific one.
I have a Post, a comedic one, explaining those Fundamental Requirements all Sciences must have, and Humanities do not have them all, protestations to the contrary or worse claims explicit or implicit like in not saying a word about, its irrelevance notwithstanding to a Definition:
https://federicosotodelalba.substack.com/p/sci-and-math-are-having-a-full-conversation?r=4up0lp
‚in the North (where people are taller) as “height increasing” and all of the alleles that are slightly more common in the South as “height decreasing”‘
Not in ex-Yugoslavia. There be giants here. 😂