
What we talk about when we talk about risk
How embryo selection exploits our flawed intuitions about risk

Polygenic risk prediction is becoming commonplace, raising the question of what exactly “risk” means. Nowhere is this question thornier than in the application to polygenic embryo selection1, where companies not only claim to predict the risk for a disease, but also the potential reduction of risk when selecting one embryo over another. This understanding of risk reduction is shaping how individual customers see the product, and how all of us think about the impact on society. Here, I argue that typical risk reduction estimates tend to exploit statistical assumptions to overstate their benefits and lead to confusion.
The liability threshold model
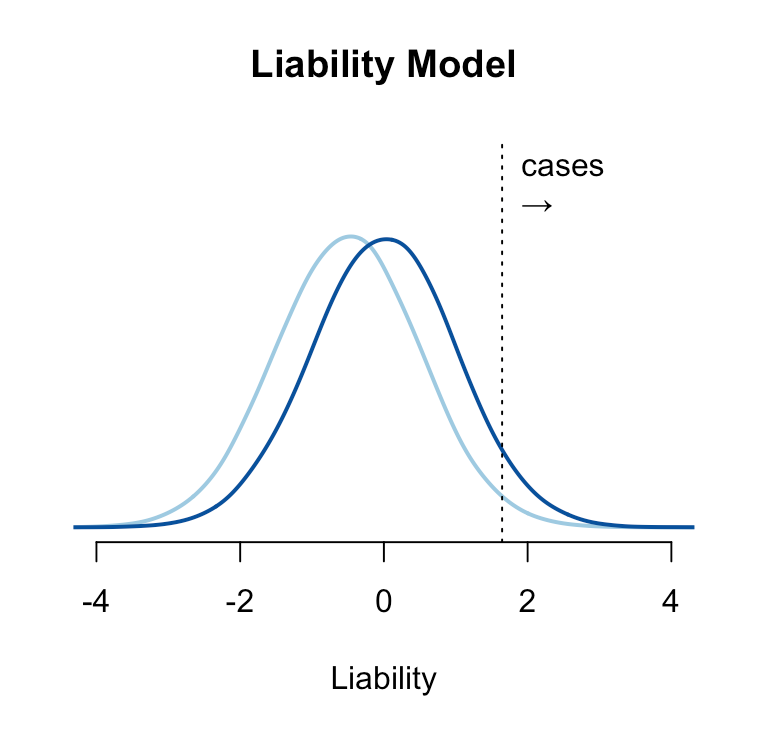
The genetic risk for a condition is typically conceptualized under the “liability threshold model”, where individuals have an underlying normally distributed liability, and those with a liability above a certain threshold have or develop the disease2. Under this model, people are born with or without the disease and stay that way (though the disease may only present itself later in life). A hypothetical risk-reducing intervention shifts the mean of the liability such that fewer people are born above the threshold. The intervention can be probabilistic (for example, it might fail in some proportion of the treated group) but if it moves a person below the liability threshold, they are by definition “cured”. A relative risk reduction of e.g. 20% under the liability threshold model means that 20% of people who would have been completely ill are instead perfectly healthy — which is probably the way most people intuitively think about risk reduction.
This model is statistically convenient and often appears to fit the data well, but is this really how disease works? And if the model is wrong, how does it change our understanding of risk reduction?
Dichotomania
A simple example where the liability threshold model fails to align with our intuitions is (Class III) obesity, defined as a BMI over a threshold of 40. For this condition, we can think about risk reduction either in terms of lower BMI or in terms of fewer individuals above the threshold. In prior simulations, I showed that for parents with BMI>40, the use of embryo selection would be expected to decrease the BMI in their offspring from a mean of 41 to a mean of … 40. Embryo selection would thus have very limited utility for this continuous trait, as it would for most continuous traits (consistent with the findings of Karavani et al. (2019) Cell that these simulations are based on). On the other hand, the same exact change would translate into a striking 50% risk reduction for the threshold trait of BMI>40 obesity. Because many people sit just above the threshold, a small change in the liability can shift a sizable fraction of individuals from just above to just below i.e. from ill to “healthy” according to the model.
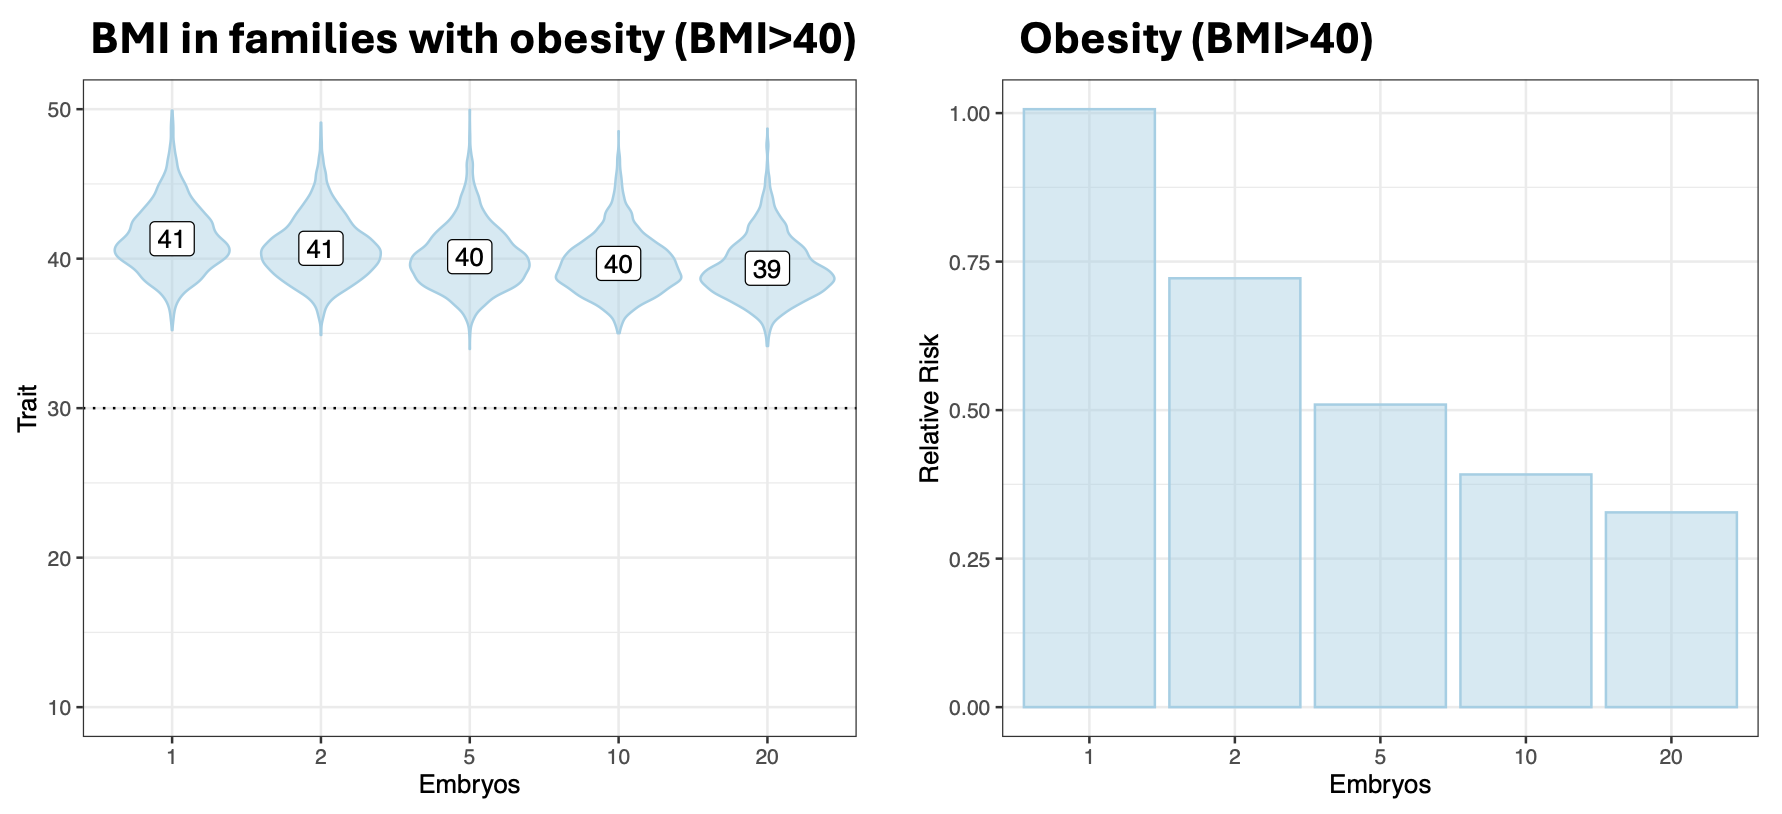
Of course, there is nothing magical about crossing the threshold from BMI 40 to BMI 39, it is hardly an “obesity cure”. Even clinicians recognize this, which is why they further subdivide obesity into into Class II (BMI 35–39.9) and Class I (BMI 30–34.9), implicitly acknowledging the underlying continuum. This tendency to impose arbitrary cutoffs on continuous values is a common issue in medicine, sometimes referred to as “dichotomania”. As it happens, many of the conditions currently being screened by embryo selection companies are defined in exactly this way: a disease label is triggered by an ad hoc threshold, with individuals just shy of the line still at risk for poor outcomes and often still advised to seek treatment. A few examples:
Type 2 diabetes: Glucose / hemoglobin measures above a threshold. Those just below the threshold are considered “pre-diabetic”, still at high risk for cardiovascular disease, and recommended for screening and lifestyle changes.
Hypertension: Blood pressure above a threshold. Those just below the threshold are considered to have “stage 1 hypertension” or elevated blood pressure and are still at high risk for cardiovascular disease.
Osteoporosis: Bone mineral density below a threshold. Those just below the threshold are considered to have “osteopenia” or low bone mass and are still at higher risk for bone fracture and often still recommended treatment.
Glaucoma: Eye pressure above a threshold. Those just below the threshold are considered to have “ocular hypertension” or elevated ocular pressure and are at high risk for glaucoma and recommended medication.
Alzheimer’s disease: Cognitive performance test scores below a threshold. Those just below the threshold are considered to have “mild cognitive impairment (MCI)” and are recommended additional screening and exercise.
Schizophrenia: Diagnostic checklist of the number and duration of psychological disturbances above a threshold. Those just below the threshold are considered to be in a “Clinical High-Risk state for psychosis (CHR-P)” and recommended for treatment, follow-up, and monitoring. [Update: as Thomas Reilly points out, schizophrenia diagnoses are more complicated than I’ve summarized here and CHR-P is too mild to be considered “just below” the threshold. There is genetic evidence in support of a schizophrenia spectrum, see the work of Ken Kendler for example, but this bullet is an oversimplification]
Medicine needs clear go/no-go decision points to be consistent and reliable, which has led to diagnostic boundaries. But such boundaries rarely reflect actual biological thresholds, they are a heuristic to aid the clinician. For the patient, what matters is the biology and consequences of disease, not whether they are assigned the label. A patient who sees an advertisement for a “50% risk reduction for Class III obesity” is probably assuming that they have a 50% chance of being brought down to healthy weight, not that they have a chance to be five pounds lighter and move from the low end of morbidly obese to the high end of moderately obese.
[Update: The issues with interpreting risk reductions for clinically binary phenotypes that actually reside at the end of a continuum were pointed out in Turley et al. (2021) NEJM. The paper makes an additional under-appreciated point: “in some instances, there is evidence that persons on the “unhealthy” side of a clinical threshold might later obtain health advantages because they would qualify for coverage of certain medical treatments, whereas their “healthy” counterparts would not”]
A lifetime of dichtomania
A more subtle form of dichotomania is the modeling of disease cases and controls as distinct entities in time. For some conditions, all people are born healthy and then go on to develop the disease through the gradual degradation of some biological process. Cancer, for example, is often driven by the accumulation of somatic mutations and the inability of the body to repair them: a person born with less effective DNA repair machinery is likely to develop cancer earlier/faster than someone with more effective DNA repair function. But if both people lived infinitely long they would both eventually develop the malignancy. This is a survival or hazard model of disease, where the population has a baseline hazard function describing the instantaneous chance of developing the condition, and high/low risk individuals have a higher/lower hazard (often quantified as a hazard ratio). Under the hazard model, interventions delay or accelerate the disease rather than “cure” it. The two models are visualized below:
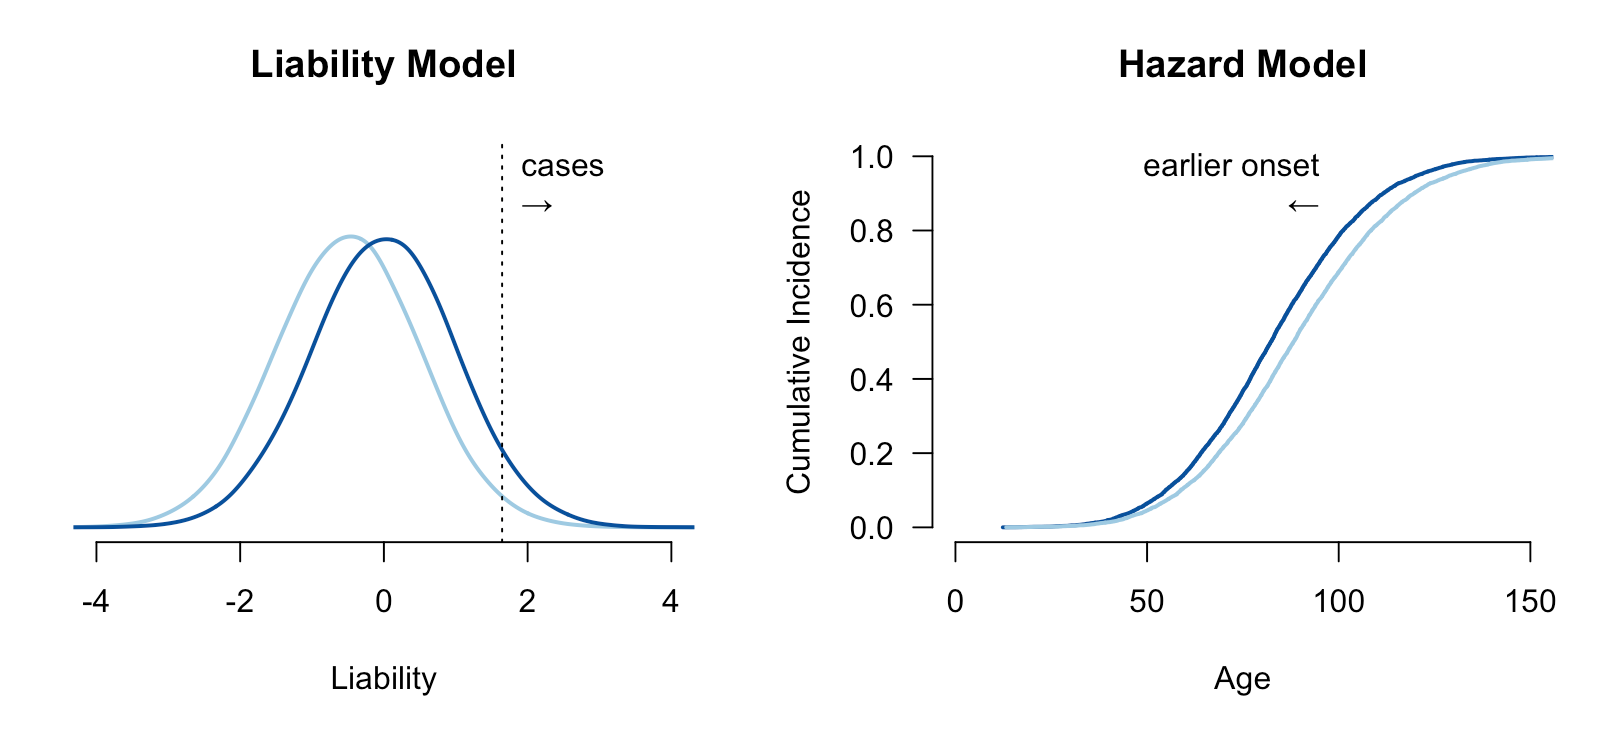
Relative risks and hazard ratios are not directly comparable: the former is defined by the ratio of total events while the latter is defined by the ratio of instantaneous rates. If the true generative model is hazard-based, then relative risk is uninterpretable, since all individuals will eventually develop the condition and thus have a risk of 100%. If the true model is threshold-based, the hazard ratio for controls is undefined, since they will never develop the disease.
Modest shifts in disease onset can look like large risk reductions
To date, most genetic risk modeling is based on estimates of relative risk reduction from middle-aged biobank cohorts and extrapolations under the liability threshold model. What does that look like for a disease that actually follows a hazard model? We can run a simple simulation to mimic a cancer-like condition. We will generate a baseline hazard and a normally distributed risk factor with a Hazard Ratio of 1.6 (per standard deviation), roughly matching the parameters observed for breast cancer incidence and polygenic scores in the literature3. Then we can introduce an intervention that reduces the underlying risk by half a standard deviation, again roughly in line with what has been reported for polygenic embryo selection. Because this is a simulation, we know exactly what happens to each person in the counterfactual with or without the intervention, allowing us to quantify the risk reduction in a variety of ways. In the figure below (first panel), we can see the cumulative incidence with all individuals eventually developing the disease and, as expected, risk reduction (light blue) leading individuals to develop the disease slightly later.
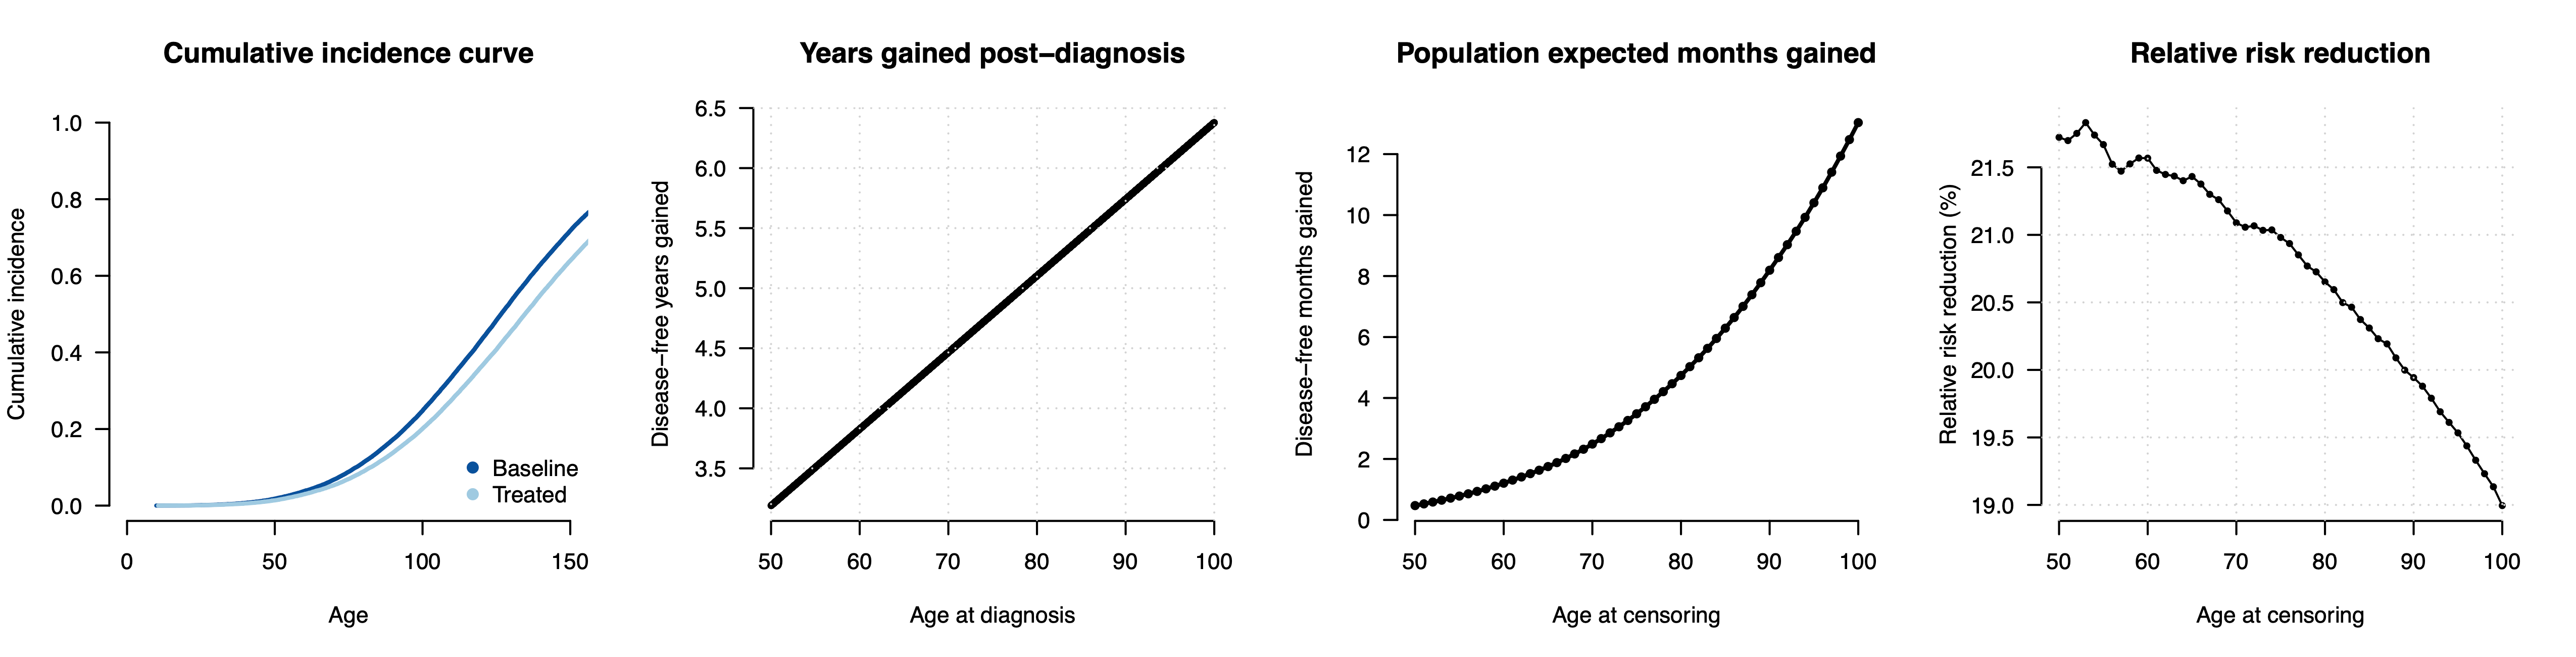
Now we can quantify the impact of the risk reducing intervention. When we compare the age at diagnosis for people who develop the disease (second panel), we see that, as expected, the intervention is merely delaying the onset: a person that would have gotten the disease at age 50 now gets it at age 53, a person that would have gotten it at age 70 now gets it at 74.5, and so on. A subtle but important consequence of this model is that the benefit of the intervention is larger later in life and for people who are already at low risk.
So far we’ve focused on people who developed the disease within the first 100 years of life, but most of the population does not develop the disease within their lifetime at all. To understand the consequences for the typical person, we can additionally impose a realistic mortality curve and ask how much “disease time” is reduced for the average individual within their lifetime (with disease-free individuals having a reduction of zero). That number (shown in the third panel) is a mere 0.5 months for the average 50 year old, increasing to 2.5 months for the average 70 year old, 4.6 months for an average 80 year old, and so on. In other words, the consequences of this intervention for a typical individual with a typical lifespan should be thought of in terms of months.
How does this compare to classical risk reduction estimates? If now run the conventional calculation and simply count up how many individuals develop the disease by a certain age with or without the intervention, we get a sizable relative risk reduction of ~20%. For example, at age 50, 1.4% of the treated and 1.8% of the untreated population will have developed the disease (from which we calculate the relative risk reduction as [0.018 - 0.014]/0.018 ~= 0.20). This 20% reduction is “real” in the sense that, if the world ended at age 50, then the number of cases would be 20% lower with the intervention. But those averted cases are not just random individuals, they are precisely the people who would have developed the disease just a few years prior. The 20% is what goes into the report, leading people to assume that they are buying a 20% chance to avoid a lifetime of illness, rather than the reality that they are buying a chance to delay their onset by 3-6 years (for those who would have developed the condition) or, for the average person, effectively by months.
While we do not yet have good methods for learning the parameters of a genetic hazard model in real data, it is consistent with observed patterns of disease. Indolent prostate tumors, for example, have been identified in a large fraction of older men on autopsy (in some cases the majority), suggesting that prostate cancer incidence increases steadily with age and would impact all men in the fullness of time. Similar mechanisms are likely at play for other traits with predictive polygenic scores: breast cancer (cells proliferating due to estrogen exposure), basal cell carcinoma and melanoma (cells accumulating mutations due to UV damage), and venous thromboembolism (increased clotting tendency).
Does this really matter?
For many interventions, the idea that you can either be healthy or ill makes perfect sense. If you have an infection you are ill, if you take an antibiotic that kills the infection you are cured. If you have appendicitis you are ill, if you get an appendectomy you are cured. These interventions are not changing the rate of illness over the lifetime, they are ending the illness. Moreover, the goal of the treatment is typically to bring an individual down to the population baseline: if one antibiotic doesn’t work completely the patient gets switched to another, they are not just left with a “lower risk” infection. The same principle is mostly true for genetic carrier screening for rare Mendelian disease, where individuals born without a rare mutation are roughly back at the population baseline.
But polygenic embryo selection is a very different type of intervention. It is neither administering a treatment to a disease, nor monitoring for earlier disease onset, nor screening out a penetrant Mendelian mutation. Rather, the underlying risk at birth is replaced with a slightly lower (or higher) value. This has implications for both the individual and the population. For the individual, the benefit of the intervention is a quantitative reduction in the underlying phenotype or delay in the onset. In fact, for polygenic prediction in adults the hazard model is already implicitly the norm. If you have a high polygenic score, the interpretation is that you will develop the condition earlier in life and should therefore start screening or preventative treatments earlier (see below). Even at the population level, the impact of polygenic selection is highly contingent on the underlying age-incidence-treatment curve for a given disease. In some cases, delayed onset could paradoxically lead to an increase in cost, if treating more older individuals incurs more complications or worse outcomes due to their frailty.
I’m emphasizing all of this because the intuition that embryo selection is a (probabilistic) cure has already taken hold. The blogger/psychiatrist Scott Alexander recently wrote a glowing post about a new embryo selection company, for which he himself is also a satisfied customer. While initially noting that the company presents their overall score in terms of “years of healthy life”, he quickly switched to talking about these interventions as lifetime cures. For example, here he is doing a cost/benefit analysis for not getting diabetes:
Consider e.g. Genomic Prediction, which costs $3,250 for five embryos and claims to lower absolute risk of Type 2 diabetes by 12%. That implies that not getting Type 2 diabetes is worth $27,000. Ask anybody dealing with regular insulin injections (let alone limb amputations) whether it would be worth $27,000 to wave a magic wand and not have Type 2 diabetes! It’s not a hard question!
… when the most likely outcome is that someone who would have had diabetes is instead at the high end of pre-diabetes and/or develops diabetes a few years later. Or here he is using the intuition of a cancer cure to contrast with other interventions:
If this were a single-use medical treatment, delivered by a doctor after someone got the relevant condition, it would be one of the biggest advances of the decade - imagine a drug that cures 10 - 40% of breast cancers with no side effects!
… when the right comparison is a drug that leads someone who would have developed breast cancer to develop it several years later. And finally, here he is extending the same logic to the level of countries and governments:
Also, it would be crazy for any forward-thinking government not to cover this; it could save hundreds of thousands of dollars in future health care expenses. In countries with public health care, this comes directly out of the government treasury; even in the US, it’s covered by Medicare after age 65. The government should be begging people to select embryos.
I don’t think Scott is doing anything nefarious here, it is very intuitive to think about risk in this way and then take the basic intuition and run with it (“now we divide by risk to estimate expected utility”, “now we extrapolate that utility to national healthcare spending”, etc). But polygenic selection does not work this way, and the marketing around embryo selection products is exploiting the complexity of risk to encourage such misconceptions.
Code to reproduce the simulations and figures.
I previously wrote about the basics of polygenic embryo selection and broader set of unknowns around the technology. Here I will focus specifically on risk estimation (which applies in other settings as well), so for a more general overview please see that post:

And for more on how the liability threshold model relates to familial resemblance, see this prior post:

In detail, the hazard function was simulated from the Weibull distribution with parameters fit such that the resulting cumulative incidence was approximately 2.2%, 4.6%, 8.1%, and 12.2% at age 50, 60, 70, 80; roughly matching the cumulative incidence of breast cancer in US women. The hazard ratio of 1.64 for the normally distributed risk factor was taken from the genetic score estimate by Mars et al. (2020). These numbers are meant to be approximate while still mirroring a real-world trait.
Intentional reference to the great Raymond Carver? Embryo selection is indeed a perverse love...great post.
This is an incredible post. Very well written!